
Figure 2.
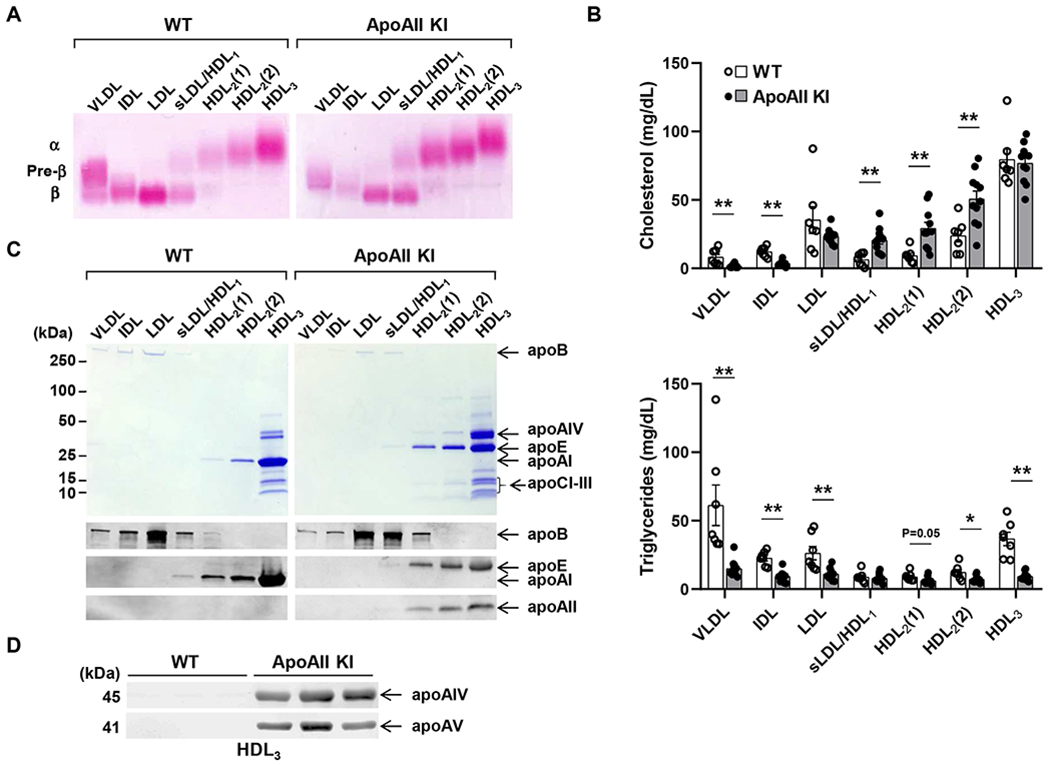
Plasma lipid and lipoprotein profiles of apoAII knock-in and WT rabbits on a standard diet.
(A) Representative agarose gel electrophoresis of lipoproteins stained with Fat red 7B. An equal volume of each fraction was resolved by electrophoresis in a 1% agarose gel. α and β indicate electrophoretic mobility. (B) Quantification of cholesterol and triglyceride content in lipoproteins. n=7-11 per group (wt: 3 males and 4 females; apoAII KI: 6 males and 5 females), 4-5 month-old rabbits. Each fraction corresponds to the densities of <1.006 (VLDL), 1.006-1.02 (−1.02, IDL), 1.02-1.04 (−1.04, LDL), 1.04-1.06 (−1.06, small LDL and HDL1), 1.06-1.08 [−1.08, HDL2(1)], 1.08-1.10 [−1.10, HDL2(2)], 1.10-1.21 (−1.21, HDL3) g/ml. (C) SDS-PAGE gel (upper panel) and immunoblot using apoB, apoE, apoAI and apoAII antibodies (bottom panel). Lipoproteins were isolated from WT and apoAII KI rabbits by sequential density ultracentrifugation according to the density ranges shown below the gels. (D) ApoAIV and apoAV were detected in the HDL3 fraction from WT rabbits and apoAII KI rabbits by Western blot. Data are expressed as mean±SEM. *p<0.05, **p<0.01 compared with WT group. Statistical analyses were performed using ANOVA for comparison among 3 groups and 2-tailed, unpaired Student’s t test between 2 groups.