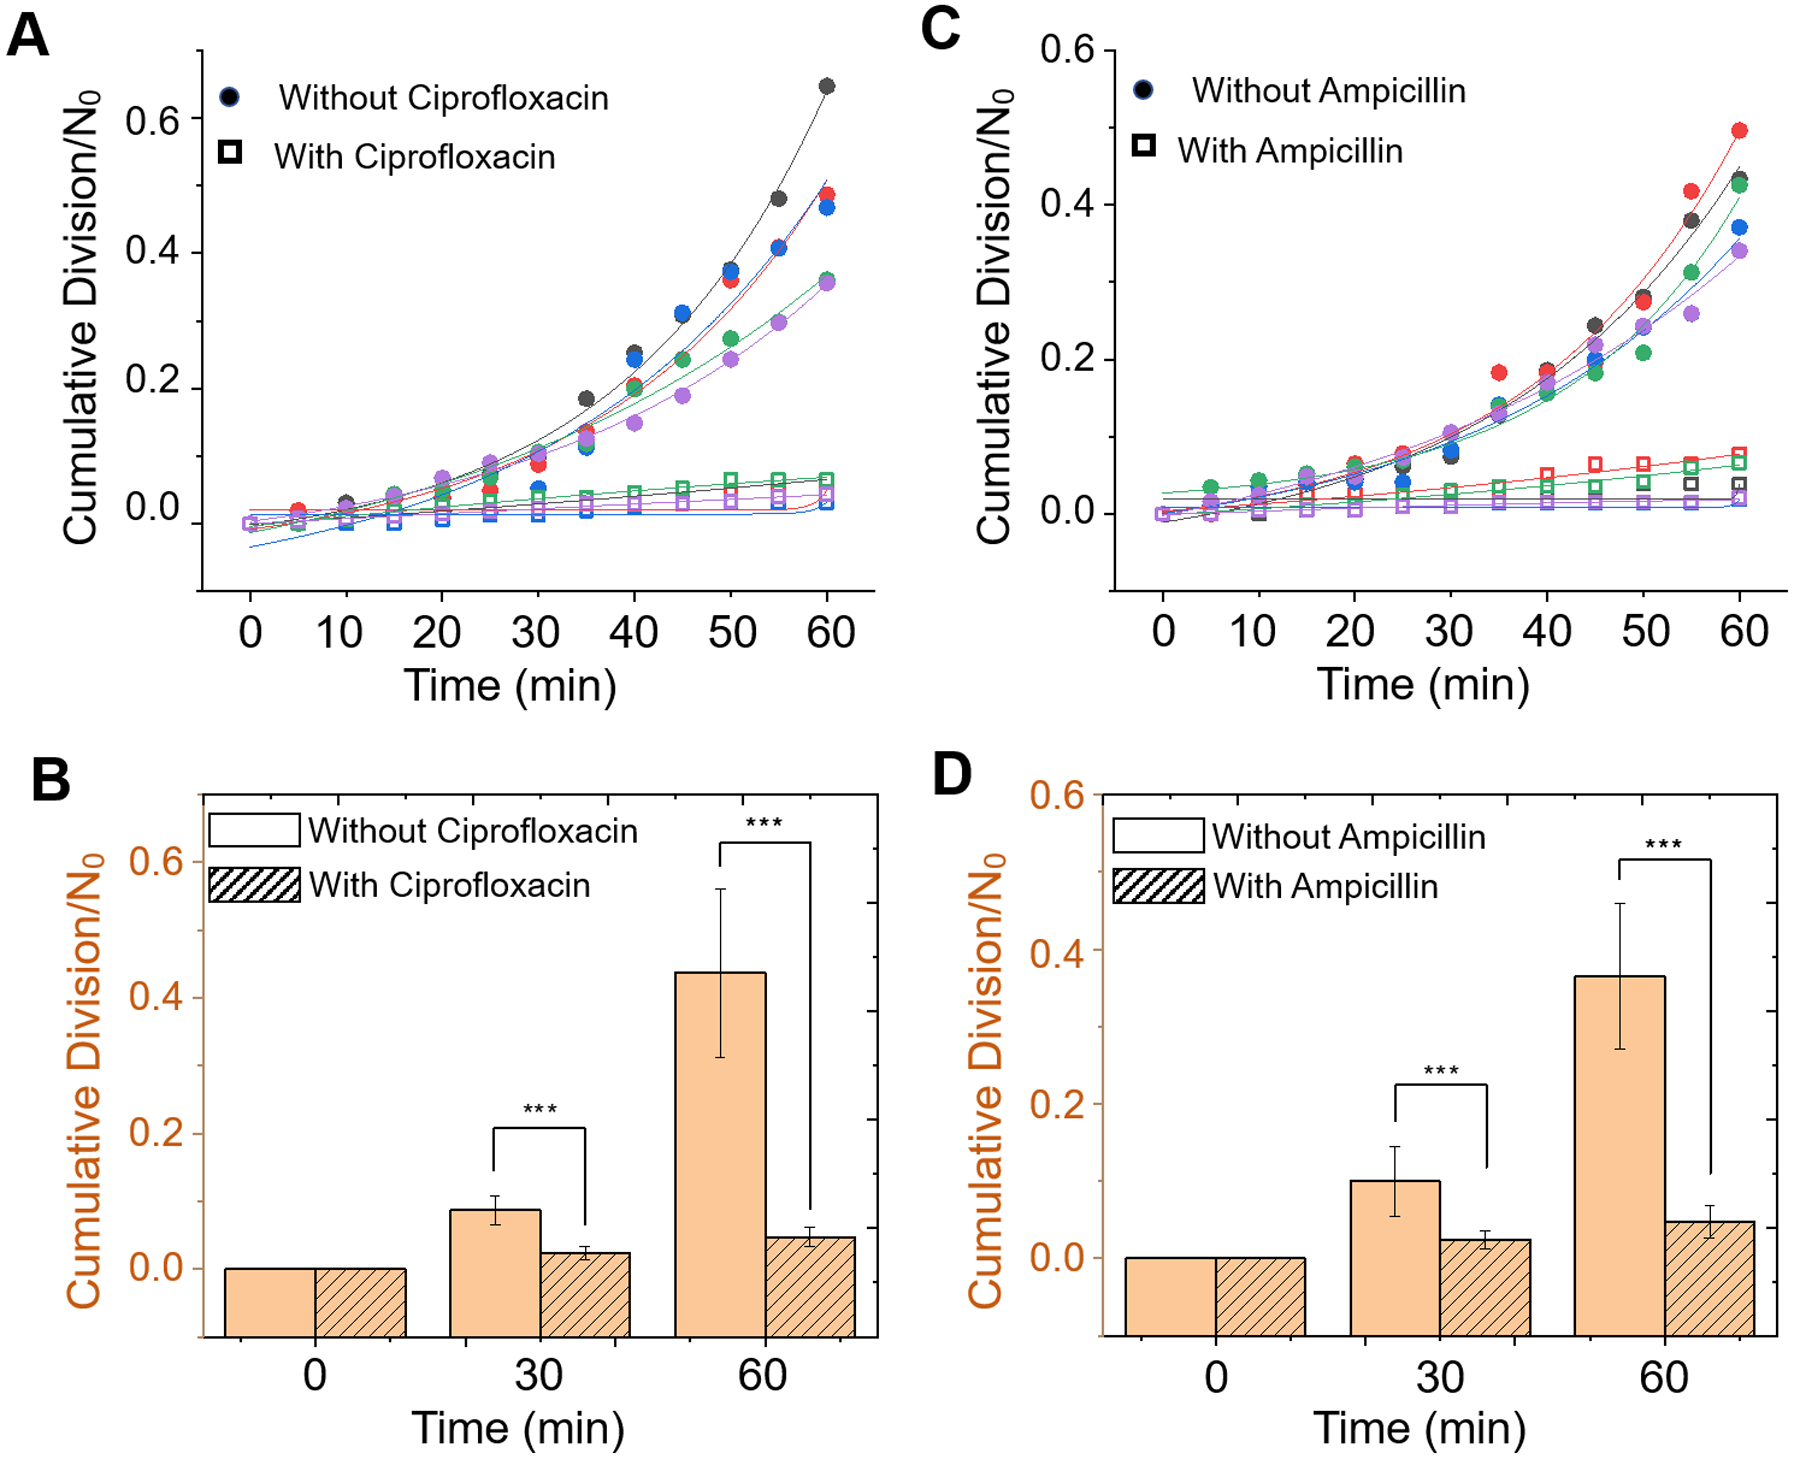
Figure 3. E. coli division tracking for digital AST with different antibiotics.

Five representative cumulative division-over-time plots for E. coli with and without antibiotics 2 μg/ml ciprofloxacin (A) and 16 μg/ml ampicillin (B). Each color represents an individual test. Dots are measured data, and the solid lines are the exponential fitting to the data. Analysis of bacterial growth in the absence of antibiotics or presence of 2 μg/ml ciprofloxacin (C) and 16 μg/ml ampicillin (D) over 60 min. *** p<0.001.
