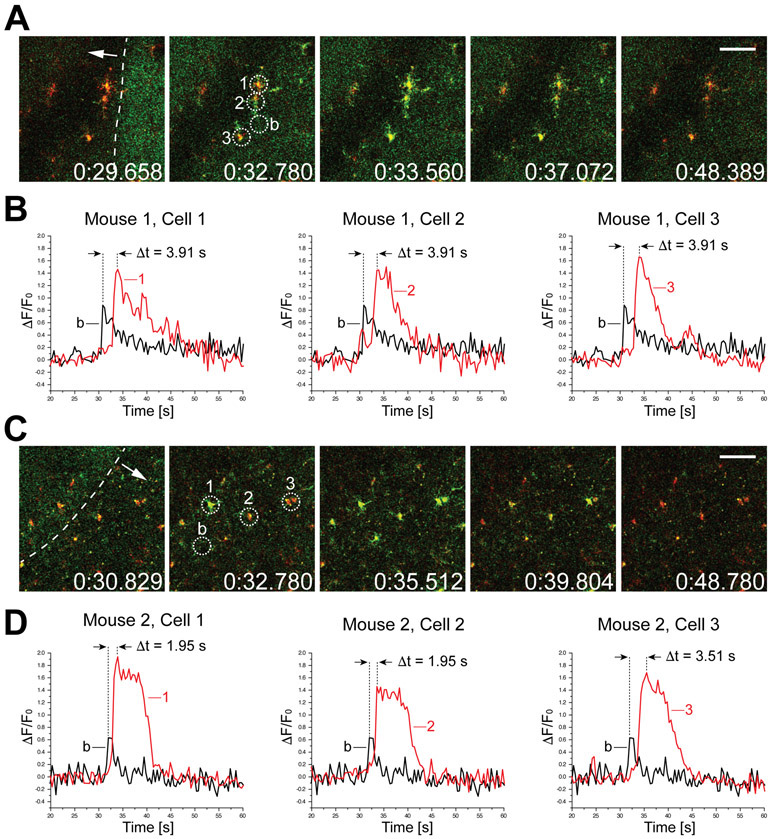
Figure 2. High-speed recordings (2.5 Hz) of microglial calcium responses to the wavefront of depolarization during late hyperacute ischemic stroke.
A, Time-stamped images (in milliseconds) of a microglial cell cluster undergoing a wave of calcium activity, documenting key phases of the pathology. tdTomato (red) and GCaMP5G (green) signals are shown here in overlay. The dashed white line in the first frame indicates the wavefront of elevated intrinsic fluorescence and the white arrow shows the direction of progression. Three cells selected for analysis of calcium activity are numbered 1-3 and circled. A nearby reference area free of microglial processes was used to calculate baseline fluorescence intensity (b). Scale bar, 50 μm. B, ΔF/F0 traces calculated over the areas indicated above. The baseline trace is shown in overlay with each of the selected cells. The time difference between the peak of the baseline fluorescence and microglial somas was found to be 3.91 s in this event. C and D, Similar analysis performed in a different animal undergoing late hyperacute ischemic stroke (approx. 12 hours after permanent occlusion of MCA). Here, the delay between the rise of intrinsic fluorescence baseline and intracellular calcium peak in microglia was between 1.95 s and 3.51 s.

