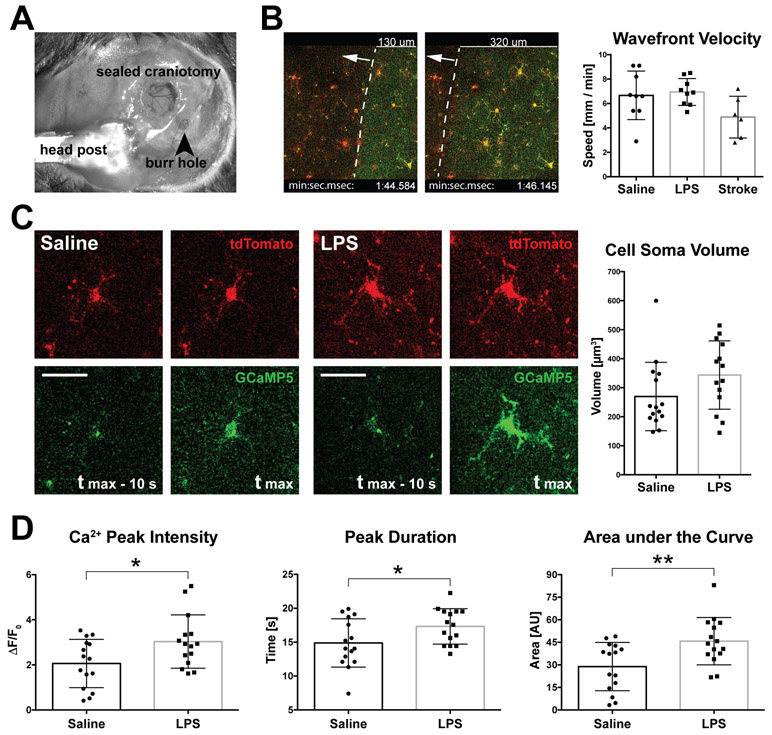
Figure 3. Chemical induction of CSD with KCl allows accurate analysis of microglial calcium activity in the normal and inflamed state.
A, Relative positions of the cranial window and burr hole over the somatosensory cortex and visual cortex, respectively, as employed in these experiments. Also shown is the headpost attached to the occipital bone. B, Microinjections of KCl induced reproducible CSD waves at mean velocities of 6 mm/min. As shown in the bar chart on the right, the wavefront velocity was unchanged after LPS treatment, but differed somewhat from the stroke-induced CSD which tended to propagate at a slower speed. C, Two-photon images of microglial cells undergoing CSD-associated calcium transient after saline (left) or LPS (right) injections. Tmax indicates the time frame of the greatest signal amplitude in the GCaMP5 channel, the frames to the left show time frames captured 10 s earlier. The microglial soma size increased following LPS injection by 27 % (graph on the right, p = 0.102, NS). Scale bar, 50 μm. D, Changes in CSD-related microglial calcium activity following LPS analyzed with ΔF/F0, Peak Duration and AOC metrics. * indicates p < 0.05, ** p < 0.01; unpaired, two-tailed t-test; n=15 cells from 3 mice per group. Bars represent means ± SD.

