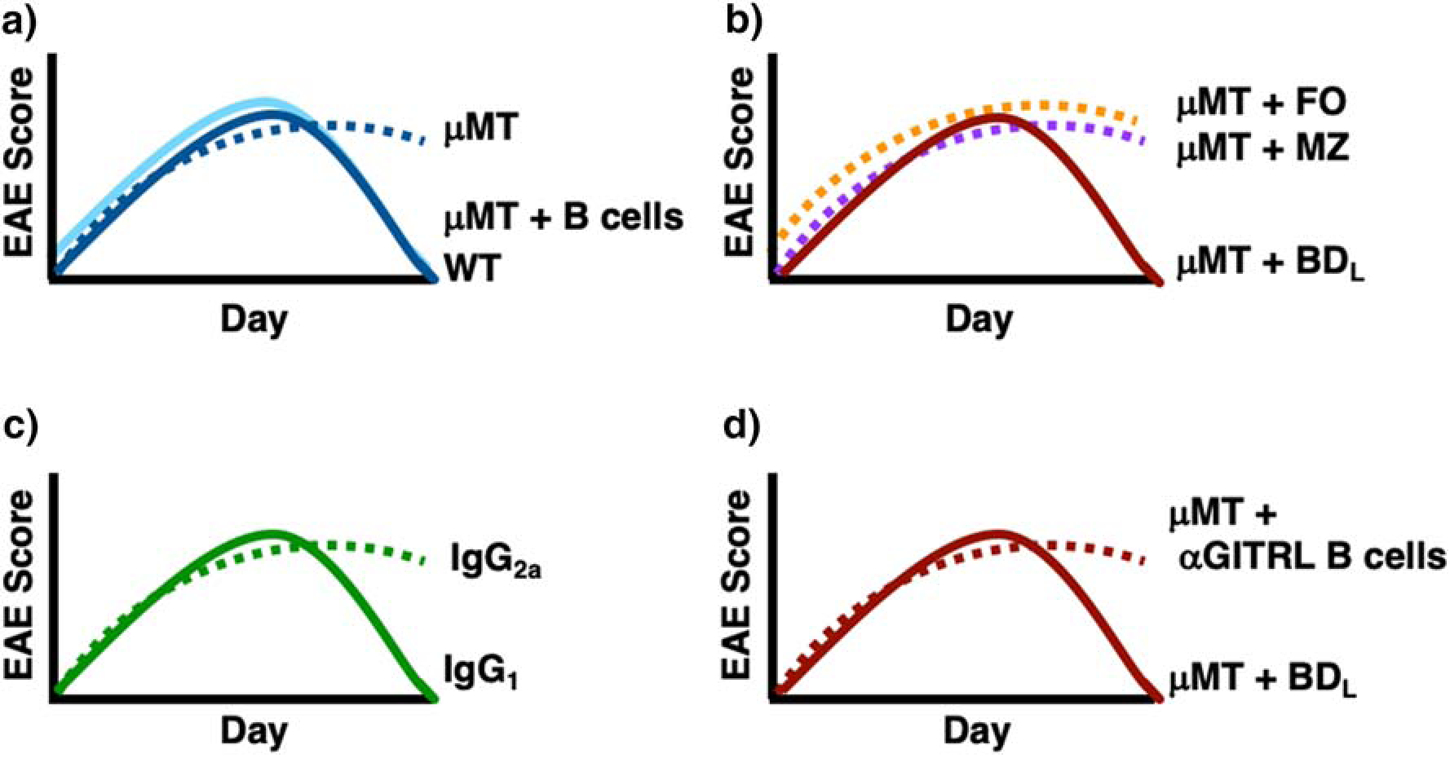
Figure 1. Graphic representation of EAE disease courses in WT and μMT mice with various B cell and anti-CD20 treatments.

Graphic EAE disease courses are shown for WT mice (A, dark blue line) that undergo recovery as compared to μMT mice (A, dark blue dotted line) that do not. μMT mice transferred either total splenic B cells (A, solid light blue line) or BDL (B,D, solid red line) recover from EAE, while those transferred FO (B, dotted orange line), MZ (B, dotted purple line) or anti-GITRL blocked B cells (D, dotted red line) do not. B cell depletion with anti-CD20 IgG2a (C, solid green line) preserves BDL and Treg numbers leading to B cell recovery, while total B cell depletion with anti-CD20 IgG1 (C, dotted green line) leads to chronic EAE.
