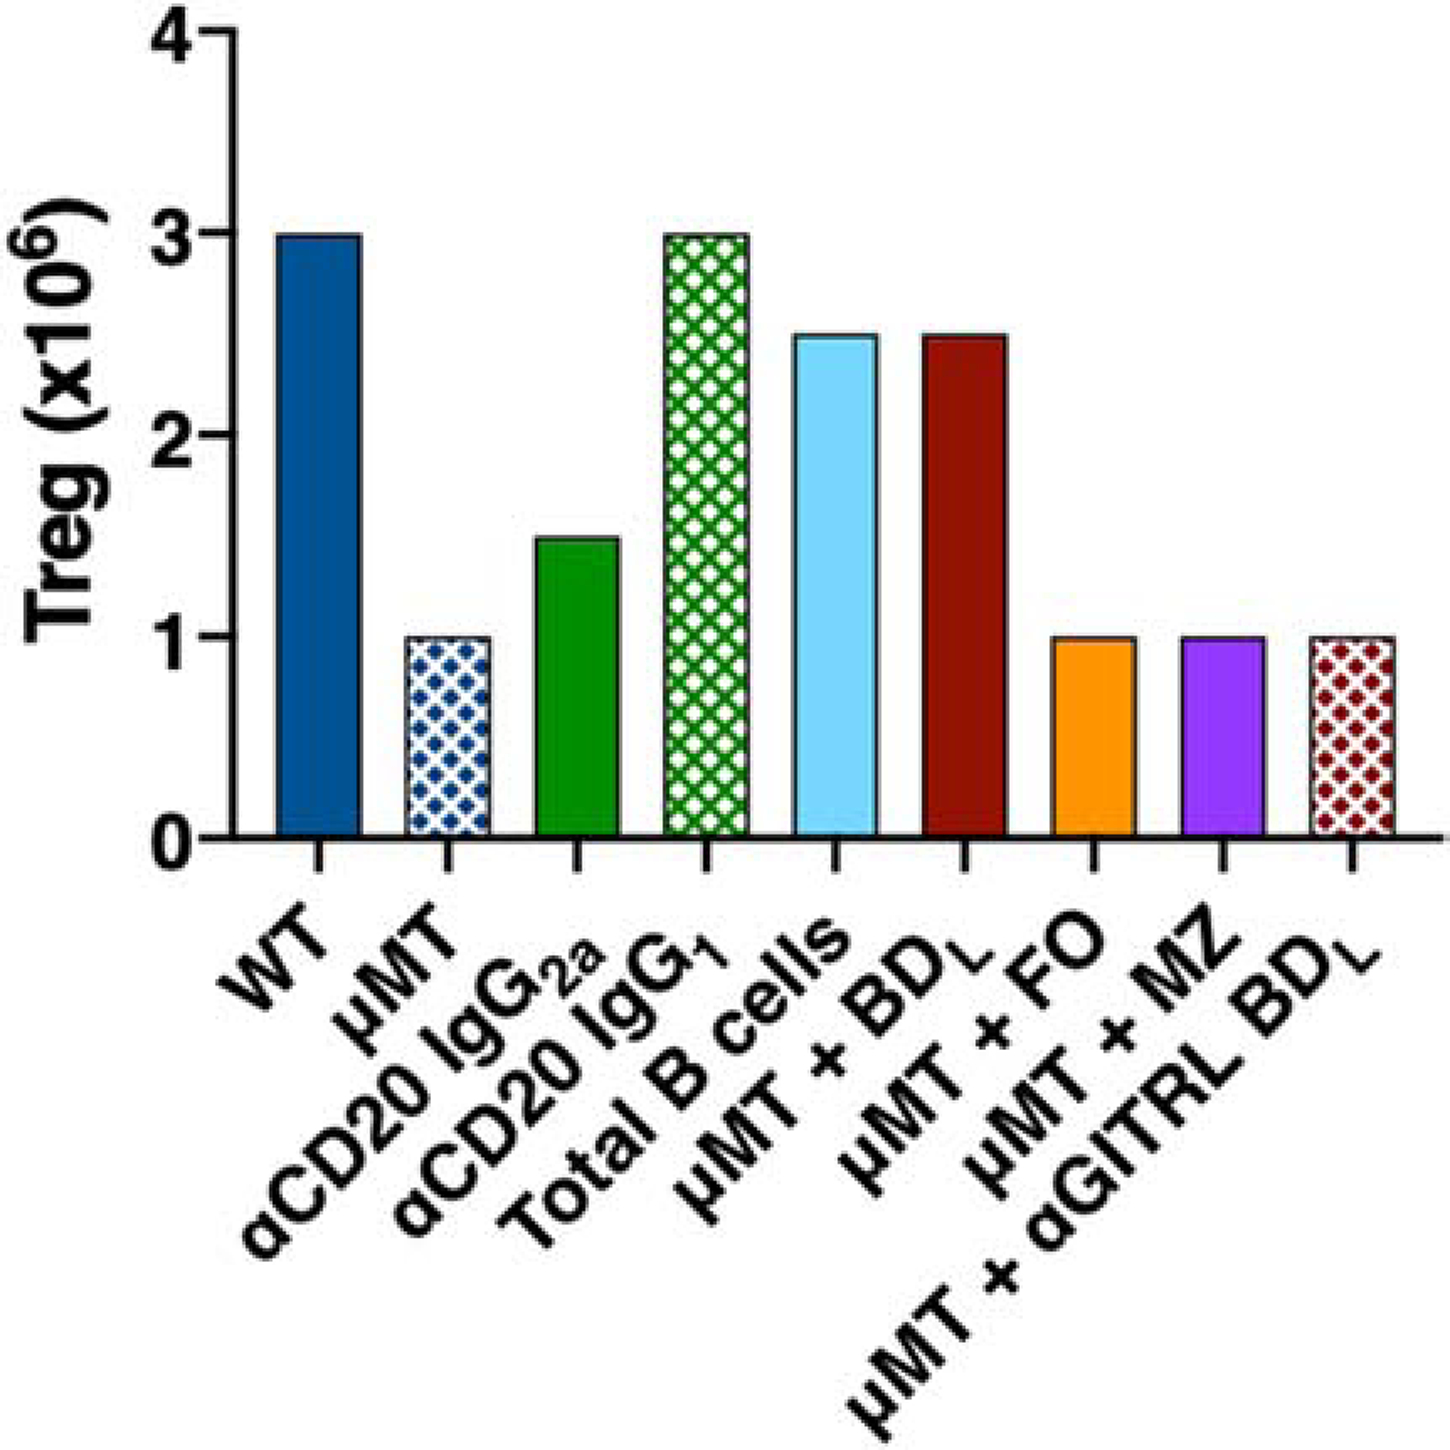
Figure 4. Graphic representation of Treg numbers in WT and μMT mice with various B cell and anti-CD20 treatments.

Based on published studies, the relative number of Treg in the spleen of WT mice treated with PBS or isotype control antibodies or administered anti-CD20 IgG2a or IgG1; and μMT mice treated with PBS or adoptively transferred FACS purified total B cells, BDL, FO, MZ or anti-GITRL-blocked BDL B cells are shown.
