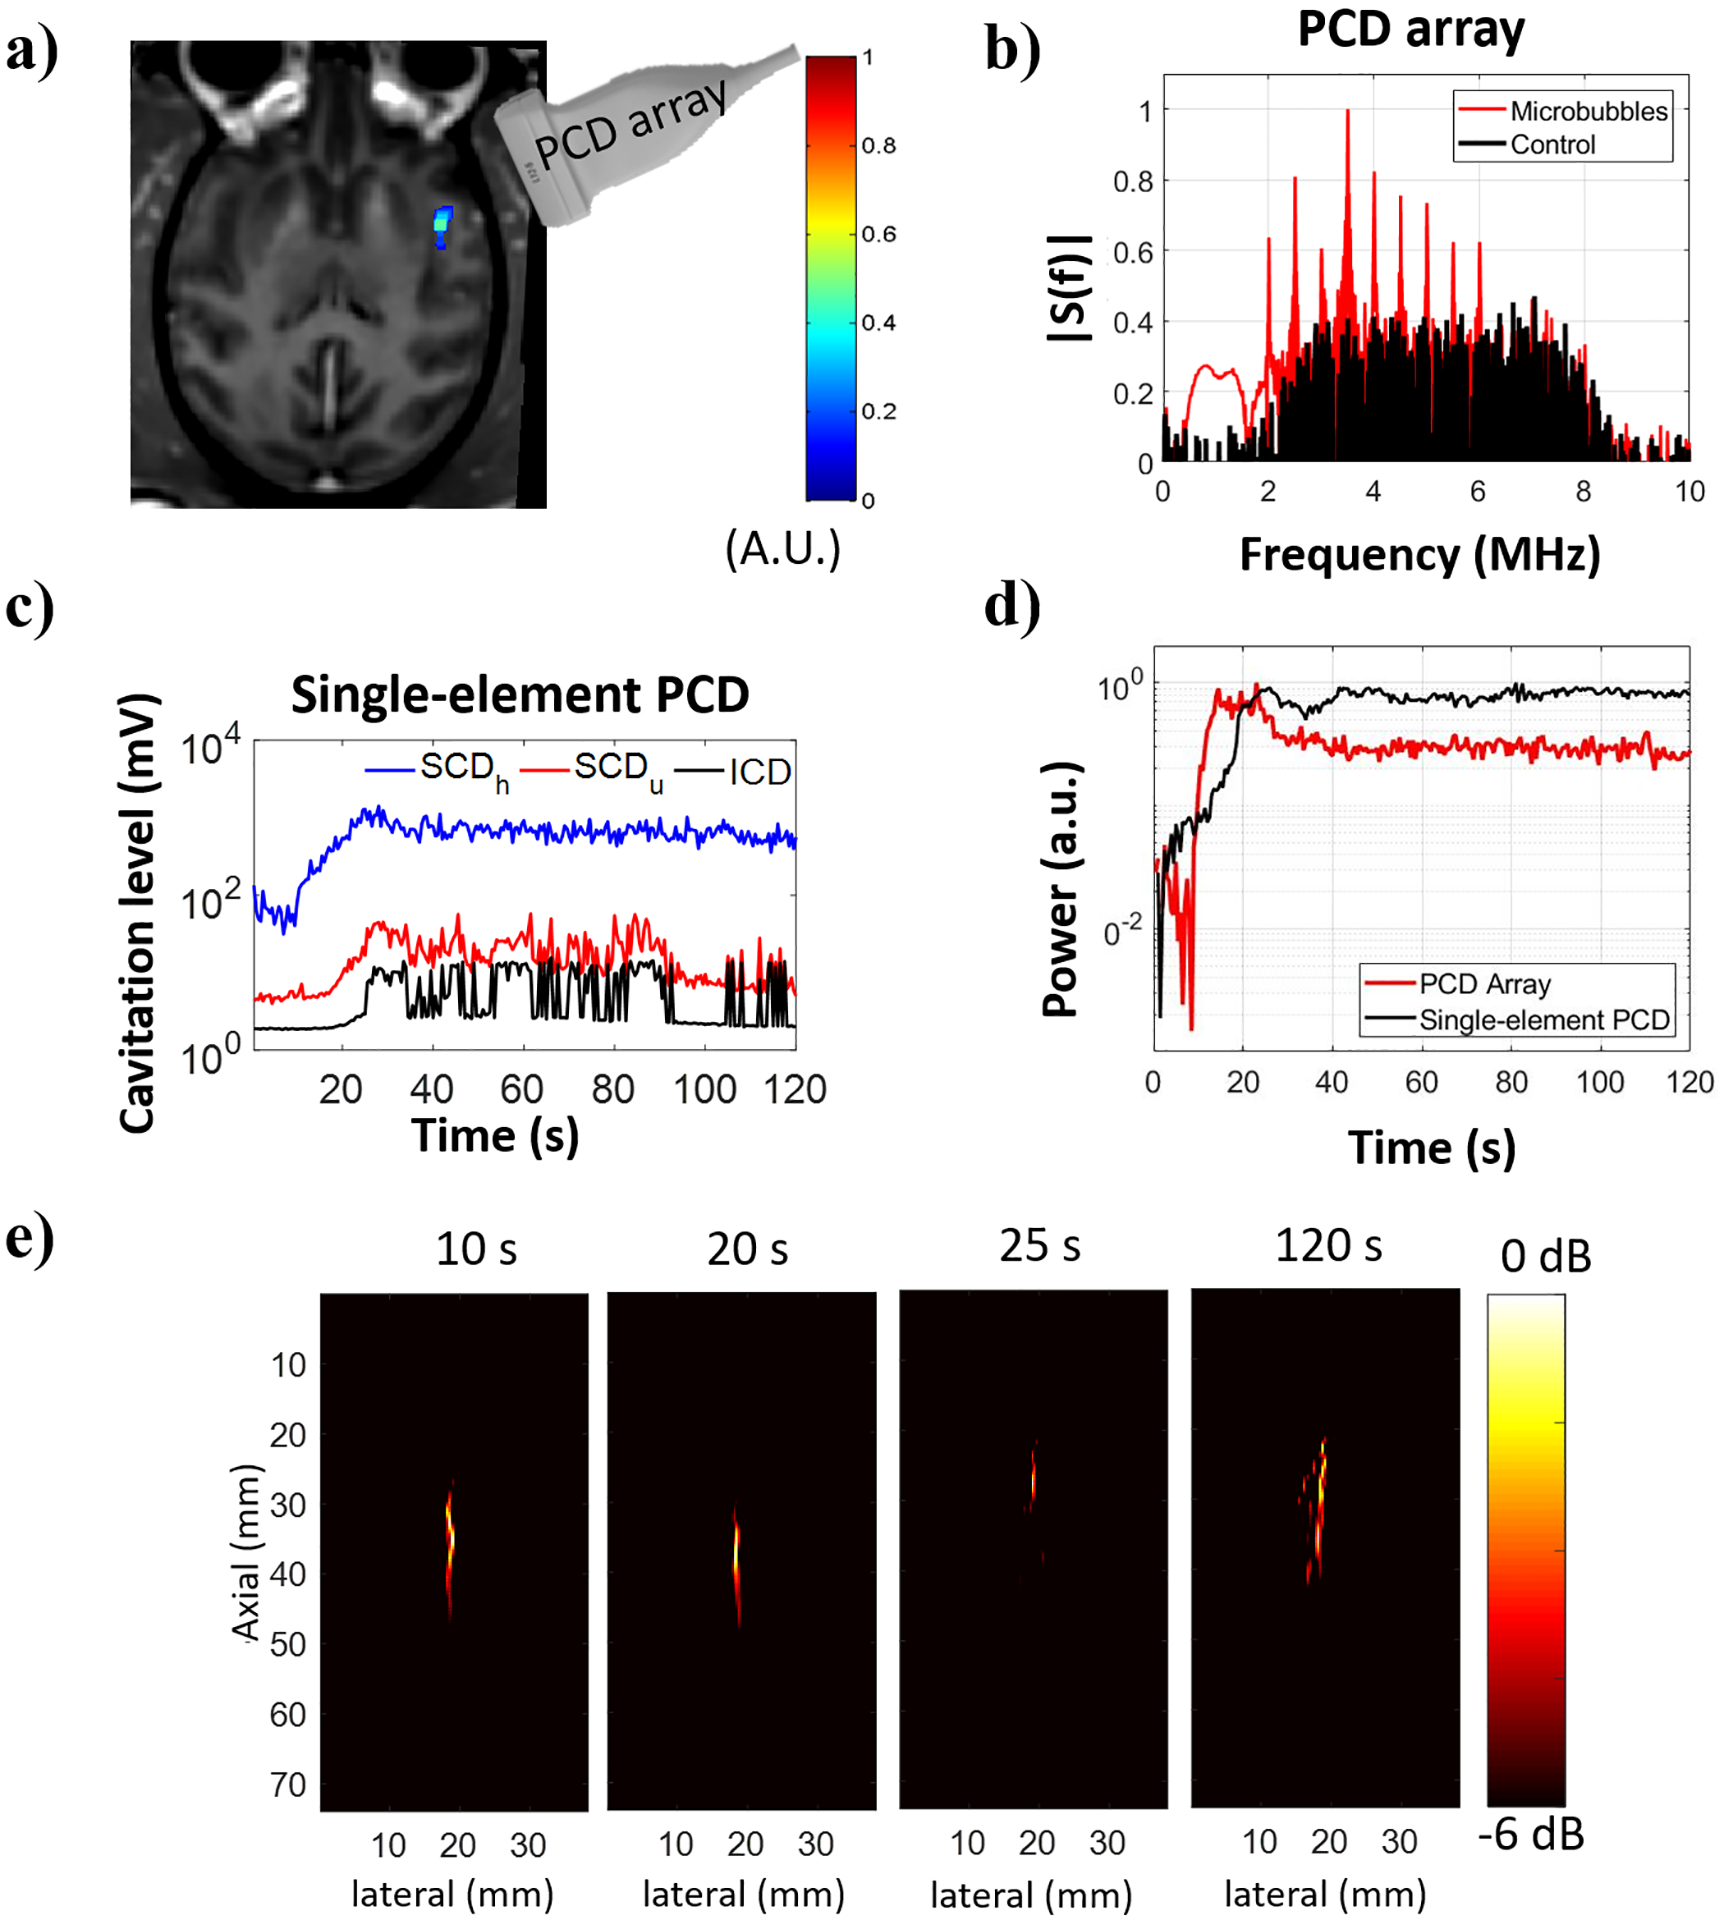
Fig. 6.

Cavitation activity recorded during BBB opening in NHP 1. (a) BBB opening (in color) induced by sonication at 450 kPa revealed in contrast-enhanced T1-weighted MR image. (b) Frequency spectra obtained from the beamformed signal at the location of maximum image intensity. (c) Cavitation activity evaluated with a single-element PCD transducer (cavitation dose). (d) Normalized power detected with a PCD array positioned at the temporal window and a single-element PCD transducer co-aligned with the FUS transducer. Power was defined as the sum of squared beamformed data using 1.44-μs integration time for the PCD array and the entire signal duration for the single-element PCD transducer. (e) Spatial distribution of the cavitation activity shown in cavitation maps (−6 dB) for different samples.
