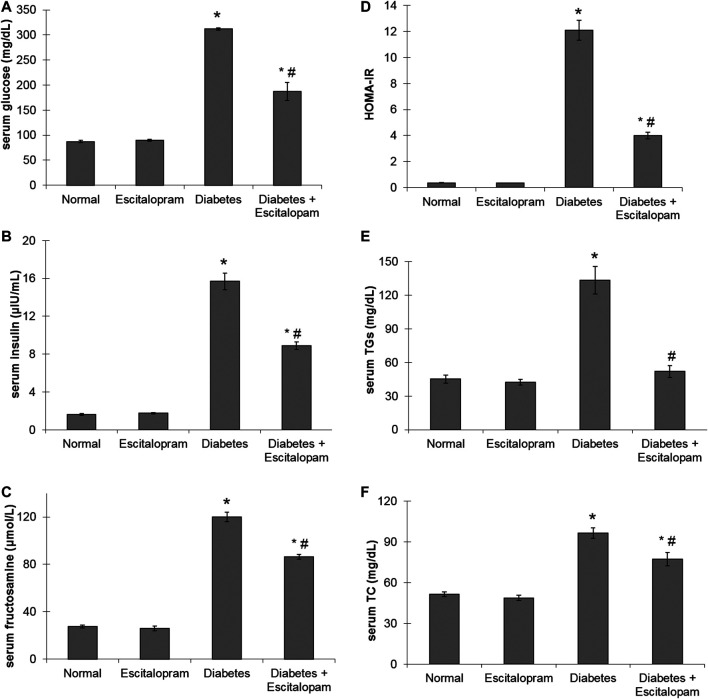
FIGURE 2.
Effect of escitalopram (10 mg/kg/day; p. o., for 4 weeks) on glycemic profile (A–D); serum levels of glucose (A), insulin (B), fructosamine (C) and HOMA-IR (D) as well as lipid profile (E, F); serum levels of TG (E) and TC (F) in HFFD/STZ type 2 diabetic rats. Each value represents the mean of six experiments and error bars represent SEM. Statistical analysis was done using One way ANOVA followed by Tukey’s post-hoc test. *p < 0.05 vs. normal, # p < 0.05 vs. diabetes.

