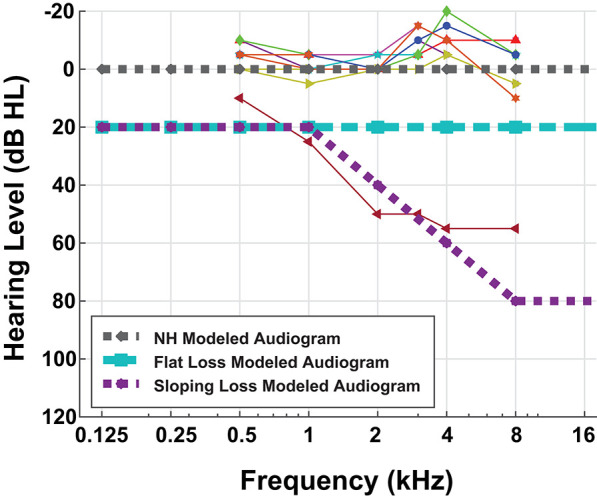
Figure 2.

Behavioral and modeled pure-tone audiograms. This figure overlays the individual participant left ear audiogram results (thin lines) with the three modeled audiometric profiles (thick dashed lines). Eight out of nine of our participants have normal-hearing (NH) audiograms, i.e., flat pure-tone thresholds near 0 dB hearing level. One of our participants had characteristic sloping hearing loss so we excluded them from further analysis. Although pure-tone thresholds do not consistently correspond with speech difficulties, we performed this hearing assessment for completeness.
