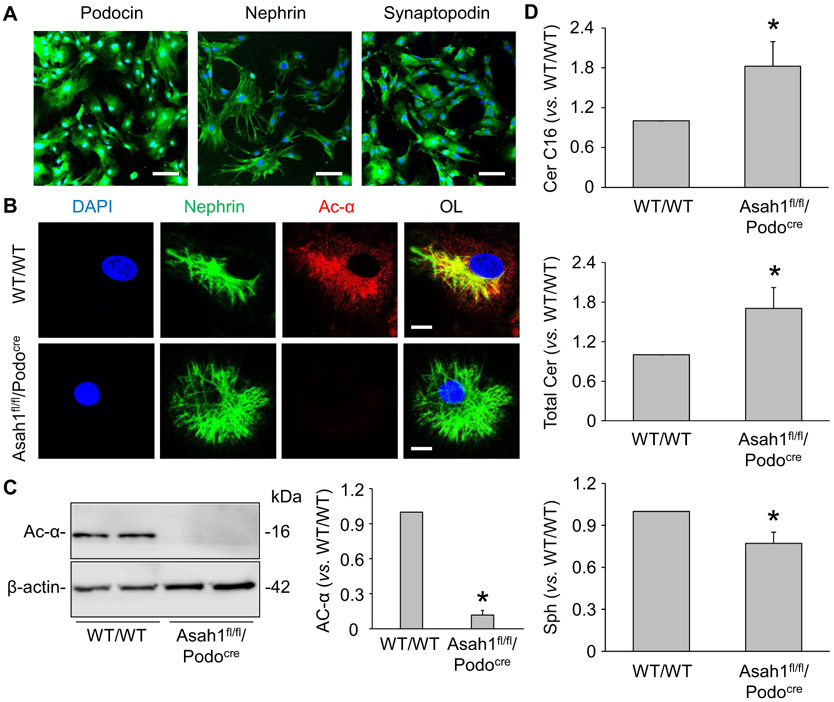
Fig. 2.
Characterization of podocytes isolated from Asah1fl/fl/Podocre mice and their littermates. A. Representative images showing the immunofluorescent staining of podocin, nephrin, and synaptopodin in podocytes isolated from WT/WT mice (n = 4). Scale bars = 100 μm. B. Representative images showing that Ac was undetectable in podocytes isolated from Asah1fl/fl/Podocre mice (n = 4). Scale bars = 20 μm. C. Representative gel documents and summarized data showing that Ac was not expressed in podocytes isolated from Asah1fl/fl/Podocre mice (n = 6). D. Summarized data showing the levels of C16 ceramide, total ceramide, and sphingosine in podocytes isolated from WT/WT and Asah1fl/fl/Podocre mice (n = 5–6). *p < 0.05 vs. WT/WT group.

