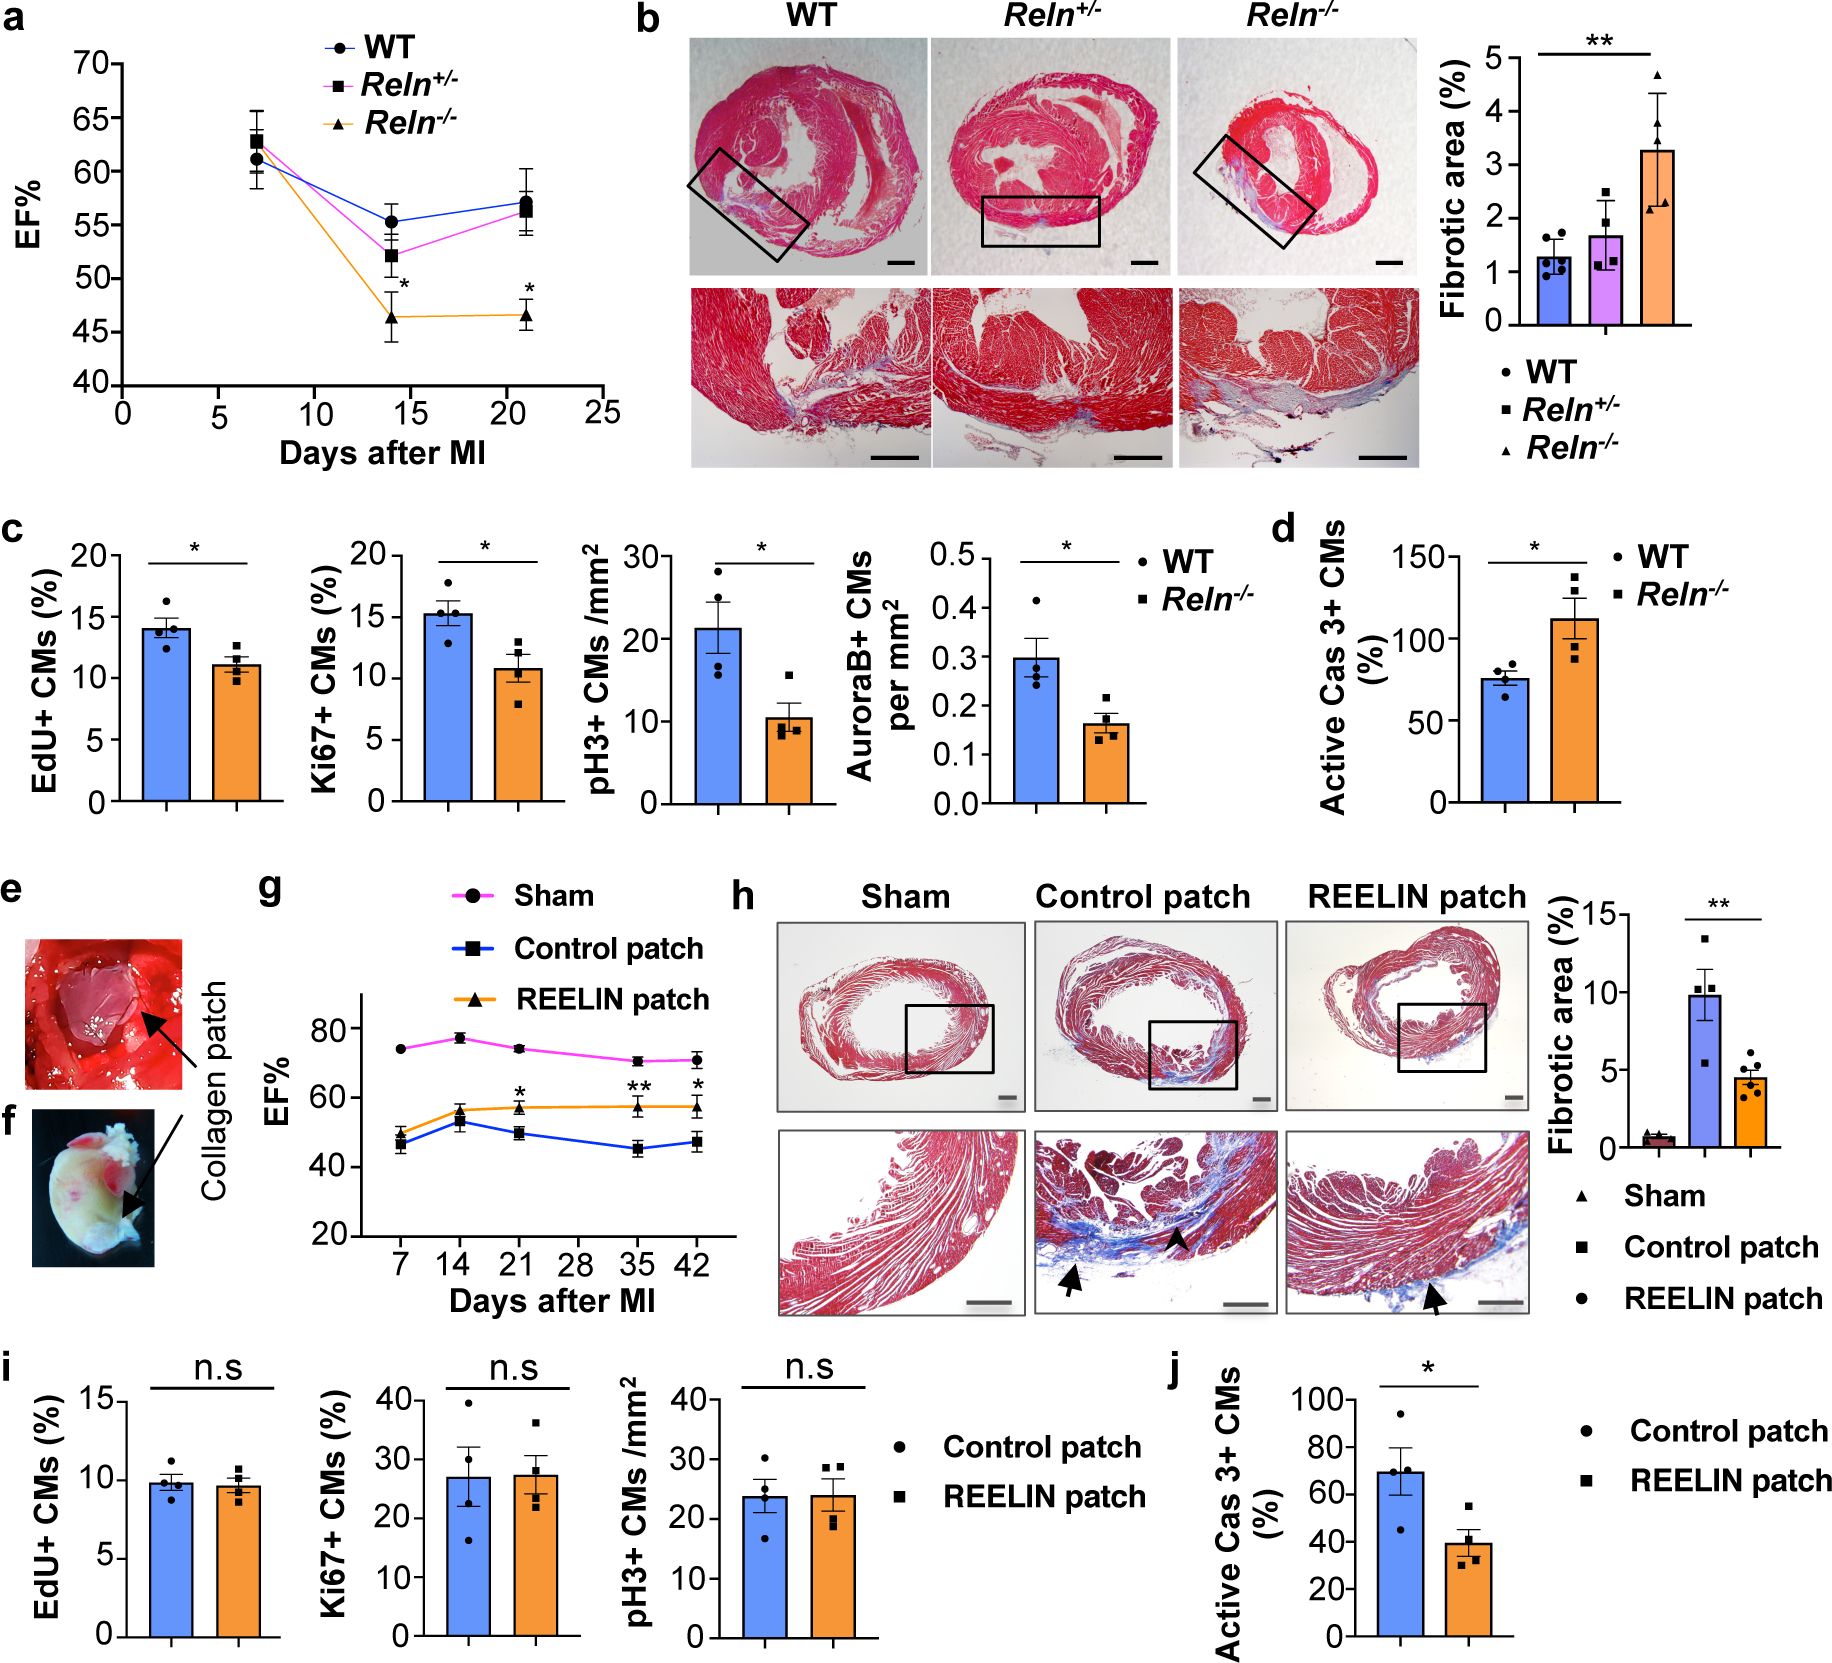
Figure 4. Reelin improves neonatal and adult cardiac function after myocardial infarction.

a, Echocardiography reveals relatively normal cardiac function at P7 and reduced at P14 and P21 in Reln−/− mice after MI at P2. P7: N=9 (WT), N=9 (Reln+/−), N=10 (Reln−/−); P14: N=10 (WT), N=8 (Reln+/−), N=7 (Reln−/−); P21: N=9 (WT), N=13 (Reln+/−), N=8 (Reln−/−). *p=0.04 (P14) and *p=0.012 (P21) by two-way ANOVA followed by Bonferroni test. b, Masson’s trichrome staining shows increased fibrosis in P21 Reln−/− hearts (MI at P2). Right panel, quantification of the percentage of fibrotic area. N=6 (WT), N=4 (Reln+/−), N=5 (Reln−/−). **p = 0.002 by one-way ANOVA followed by Tukey’s test. c, CM proliferation is decreased in the border of the infarcted area of P7 Reln−/− hearts (N= 4 mice/genotype). *p=0.026 (EdU), *p=0.025 (Ki67), *p=0.022 (pH3) and *p=0.023 (AuroraB) by unpaired two-tailed Student’s t test. d, CM apoptosis increases significantly in the infarcted area of P7 Reln−/− hearts (N= 4 mice/genotype). *p =0.032 by unpaired two-tailed Student’s t test. e, Sutured collagen patch onto the adult mouse heart following MI. f, Residual collagen patch remains up to 42 days after MI. g, Echocardiography reveals significantly improved cardiac function (EF%) in adult mice with REELIN patches starting at around 21 days after MI and up to 42 days post-MI. N=6 (sham), N=6 (control patch) and N=7 (REELIN patch). *p=0.04 (P21), **p=0.001 (P35) and *p=0.01 (P42) by two-way ANOVA followed by Bonferroni test. h, Masson’s trichrome staining shows reduced cardiac fibrotic area in REELIN patch-treated mice 42 days post-MI. Arrowhead shows fibrotic area; arrows indicate residual collagen patch. Right panel, quantification of the percentage of fibrotic area. N=4 (sham), N=4 (control patch), N=6 (REELIN patch). **p = 0.003 by one-way ANOVA followed by Tukey’s test. i, No differences in CM proliferation between control patch and REELIN patch treated hearts were observed in the infarcted areas 7 days post-MI (N = 4 hearts/group). n.s. not significant difference by unpaired two-tailed Student’s t test. j, CM apoptosis is reduced in the infarcted area of REELIN patch treated hearts (N=4 mice/group). *p = 0.039 by unpaired two-tailed Student’s t test. Data are presented as Mean ± S.E.M. Scale bars, 500 μm (b, h). Representative images of c, d, i and j are in Extended Data Fig. 11. Functional parameters for the neonatal and adult MI echocardiography are in Source Data.
