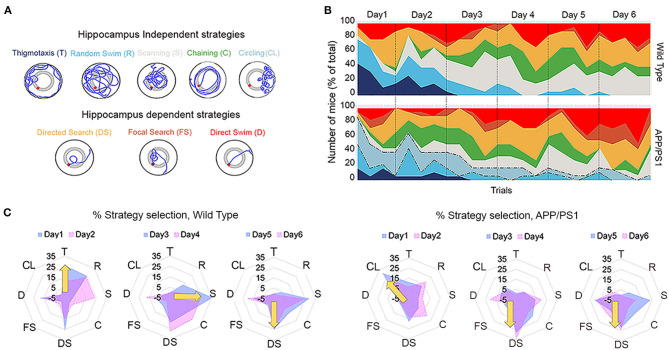
Figure 2.
Sequential strategies deployed by wild-type (WT) and APP/PS1 mice during Morris water maze learning. (A) Schematic representation, color code, and abbreviations for each search strategy. The strategies have been classified as hippocampus independent (T, R, S, C, and CL) and hippocampus dependent (DS, FS, and D). (B) The average prevalence of each strategy by trials across days of training is shown. Note the circling strategy preference (dotted lines) of APP/PS1 during water maze learning. (C) Radar plots describing the day-wise average percentage strategy preference during learning by APP/PS1 (right) mice in comparison to WT (left). Note the clear shifts in strategy preference from global to local to spatial in WT (yellow arrow) and the preference of APP/PS1 (yellow arrow) toward circling, followed by an abrupt shift to spatial strategies. Data are presented as mean ± SEM; n = 18.

