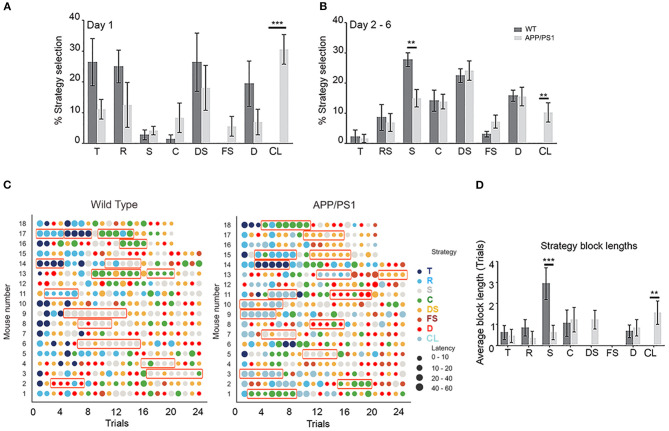
Figure 3.
Percentage changes in search strategies between wild-type (WT) vs. APP/PS1 mice. The percentage changes in search strategies between WT vs. APP/PS1 during day 1 (A), followed by days 2–6 (B), of training are depicted. (C) A scatter plot of varying latency (size) vs. strategy (color) across all trials in individual animals. The greater the size of the circle, the more the latency. Strategy block length is defined as a sequence of at least three trials with the same strategy. Total block length is the sum of all blocks per strategy per mouse and is highlighted with rectangular orange icons. The last four trial's representations are missing from WT animal nos. 16, 17, and 18 and APP/PS1 mice nos. 15, 16, 17, and 18 due to the bad quality of the recorded videos, which thus could not be used for strategy analysis. (D) Average total block lengths for each search strategy during water maze learning. Data are presented as mean ± SEM; n = 18. **P = 0.0021, ***P = 0.0002.

