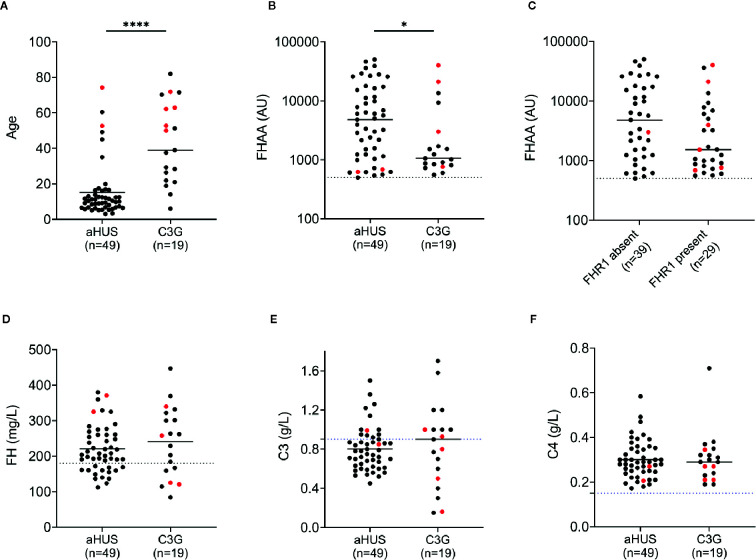
Figure 1.
FH autoantibodies (FHAAs) and key biomarkers at the age-of-onset of disease in patients with aHUS and C3G. Patient with M- proteins are in red. (A) Age; (B) FHAA titers in aHUS and C3G; (C) FHAAs (C3G and aHUS) with and without FHR1; (D) FH levels; (E) C3 levels; (F) C4 levels. Solid lines: medians. Dashed lines: normal cutoff based on results from 300 healthy individuals. *P < 0.05 and ****P < 0.0001 by Mann-Whitney U test.

