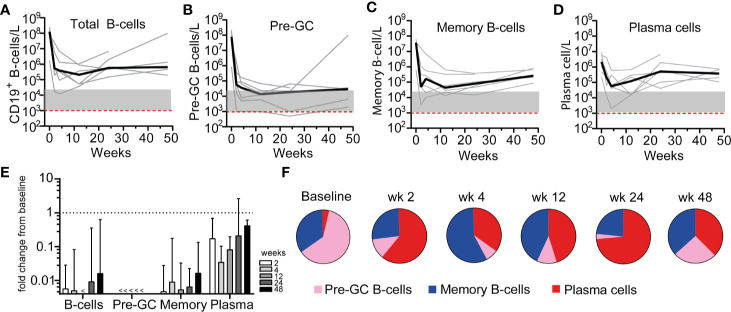
Figure 2.
Residual memory and plasma cells after RTX. Absolute counts of (A) total CD19+ B-cells (B), Pre-GC B-cells (C), memory B-cells, and (D) plasma cells are shown for each individual patient that received remission-induction therapy with RTX (n = 6). The median is indicated by the thick black line. Red dashed line indicates the mean detection limit for HSFC. Gray area indicates 1–20 analyzed events (E). Median ± IQR fold change as compared to baseline for each B-cell subset per timepoint is shown (F). Mean distribution of B-cell subsets per timepoint during RTX treatment is shown.

