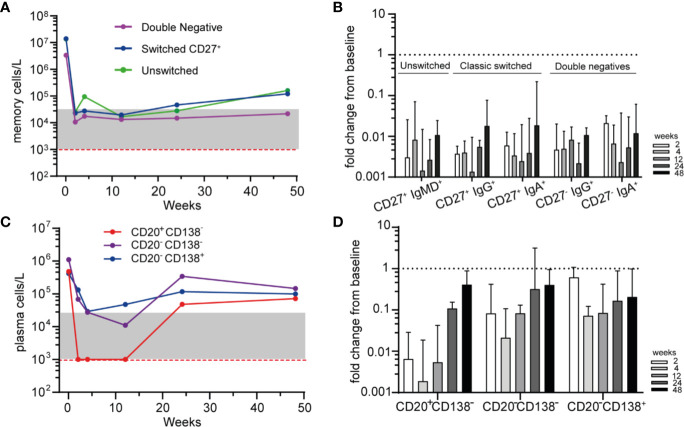
Figure 3.
Phenotyping residual memory and plasma cells after RTX (A). Median absolute counts of unswitched memory (CD27+IgM+ and/or IgD+), switched memory (CD27+IgG+ or IgA+) and double negative (DN, CD27−, IgG+, or IgA+) B-cells are shown for AAV patients (n = 6) after remission-induction treatment with RTX (B). Median ± IQR fold change from baseline for different memory B-cell subsets are shown for each timepoint after RTX (C). Median absolute counts of PBs (CD20+CD138−, red), PrePCs (CD20−CD138−, purple) and mPCs (CD20−CD138+, blue) are shown for AAV patients (n = 6) after RTX as remission-induction therapy (D). Median [IQR] fold change from baseline for the subsets in A are shown for each timepoint after RTX. Red dashed line indicated the detection limit for HSFC. Gray area indicates 1–20 analyzed events.

