Figure 4.
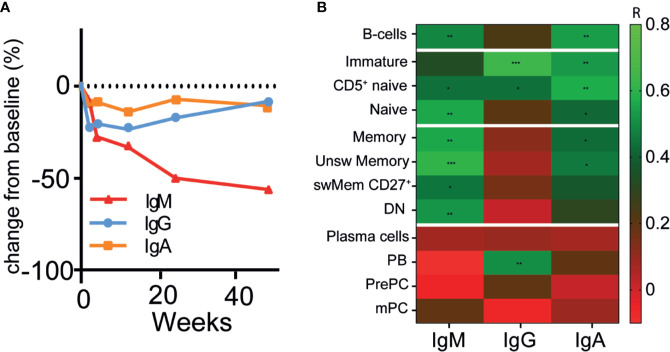
Changes of circulating immunoglobulins were not reflected by plasma cell kinetics after RTX (A). Median percentage change in total immunoglobulin -M (red line), G (blue line) and -A (orange line) levels after RTX as remission-induction treatment over time (n = 6) (B). Heatmap of spearman correlations of the change in IgG, IgM, and IgA with the change in different B-cell subsets as compared to baseline for all timepoints (n = 6). Gradients indicates Spearman’s R. *p < 0.05, **p < 0.01. ***p < 0.001.

