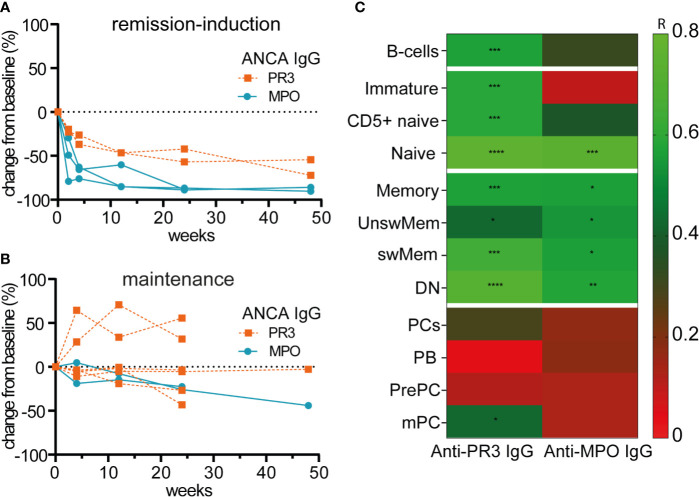
Figure 5.
Changes of circulating ANCAs associated with changes of naive and memory B-cells but not with plasma cells after RTX (A). Individual percentage change as compared to baseline of anti-PR3 and anti-MPO IgG serum levels after remission-induction with RTX treatment (n = 5) (B). Individual percentage change as compared to baseline of anti-PR3 and anti-MPO IgG serum levels is shown for each patient that received RTX as maintenance treatment (n = 8) (C). Heatmap of the Spearman correlations of changes in anti-MPO IgG (n = 6) and anti-PR3 IgG (n = 8) with changes in B-cell subsets as compared to baseline for all timepoints (n = 14). Gradients indicates Spearman’s R. *p < 0.05, **p < 0.01, ***p < 0.001, ****p < 0.0001.

