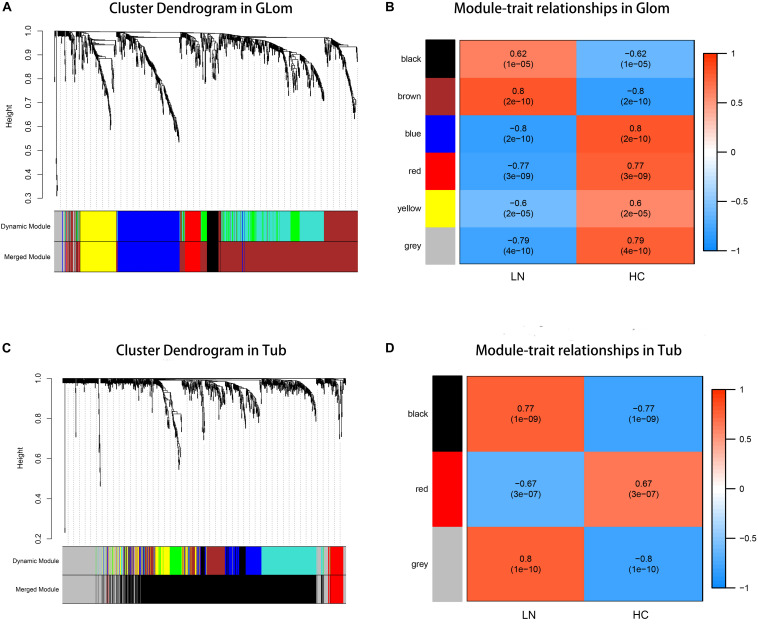
FIGURE 2.
Weighted gene co-expression network analysis (WGCNA) analysis. (A) The cluster dendrogram of co-expression genes in glomeruli. (B) Module–trait relationships in glomeruli. Each cell contains the corresponding correlation and p-value. (C) The cluster dendrogram of co-expression genes in tubulointerstitia. (D) Module–trait relationships in tubulointerstitia. Each cell contains the corresponding correlation and p-value. LN, lupus nephritis; HCs, healthy controls; Glom, glomeruli; Tub, tubulointerstitia.

