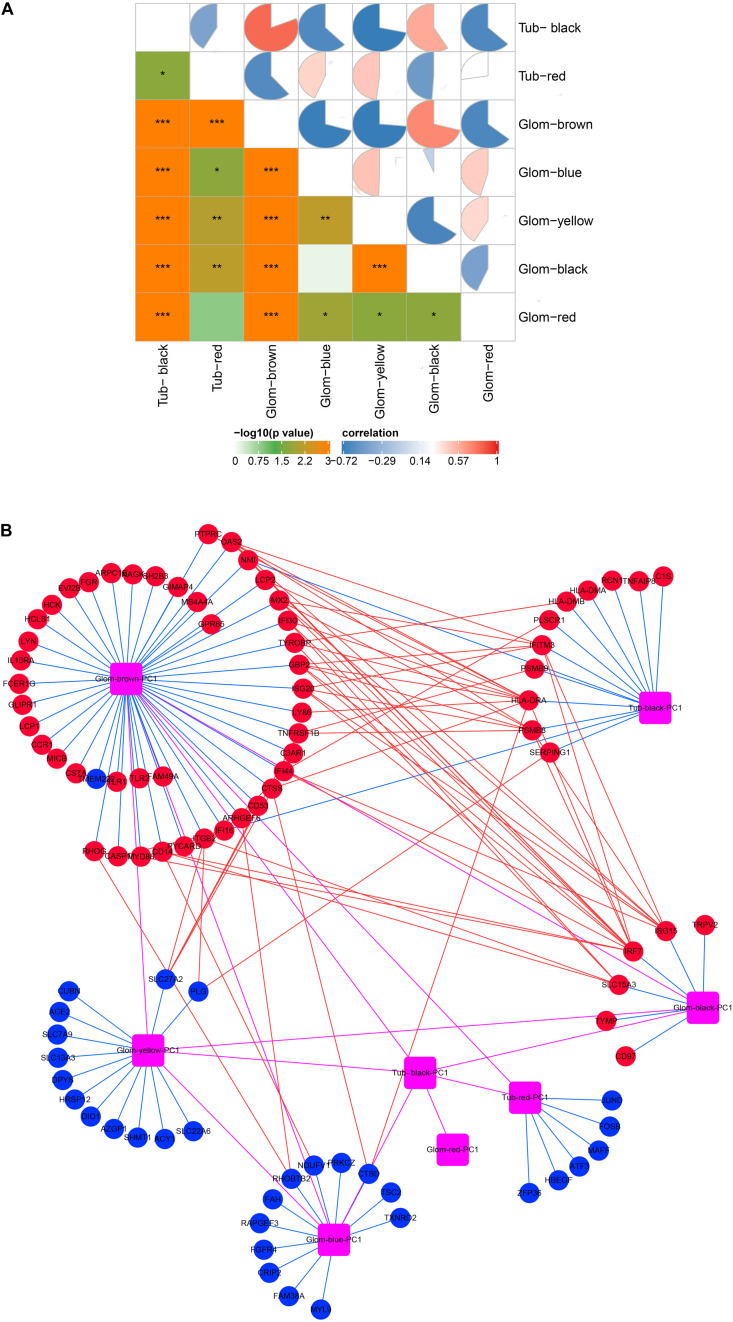
FIGURE 3.
Molecular crosstalk analysis. (A) The correlation between modules in glomeruli and tubulointerstitia. (B) The interaction of hub genes located in various modules. Glom, glomeruli; Tub, tubulointerstitia; PC1, first principal component. Blue lines represent inclusion relationship of modules to hub genes; red lines represent the interaction between the hub genes located in different modules; magenta lines represent the interaction between various modules; red represents upregulation; blue represents downregulation. “*” represents p < 0.05, “**” represents p < 0.01, “***” represents p < 0.001.

