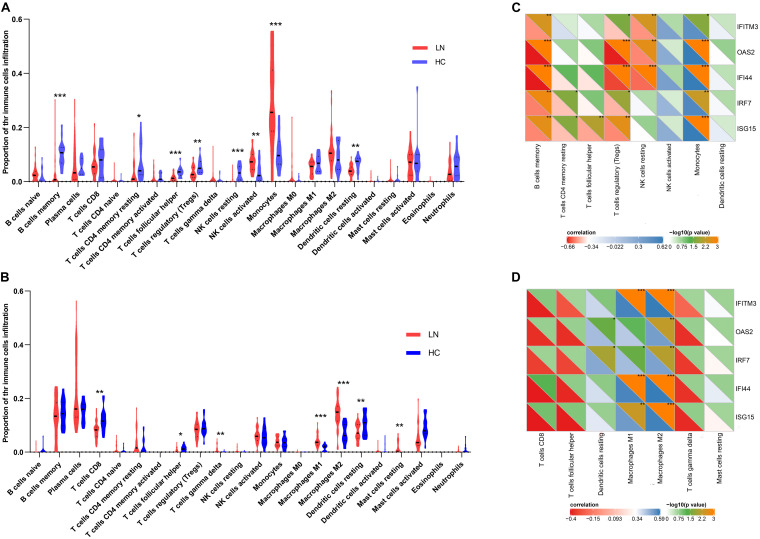
FIGURE 4.
Immune cell infiltration analysis. (A) The proportion of the immune cell infiltration in glomeruli. (B) The proportion of the immune cell infiltration in tubulointerstitia. (C) The correlation between the crosstalk genes and eight types of immune cells in glomeruli. (D) The correlation between the crosstalk genes and seven types immune cells in tubulointerstitia. “*” represents p < 0.05, “**” represents p < 0.01, “***” represents p < 0.001.

