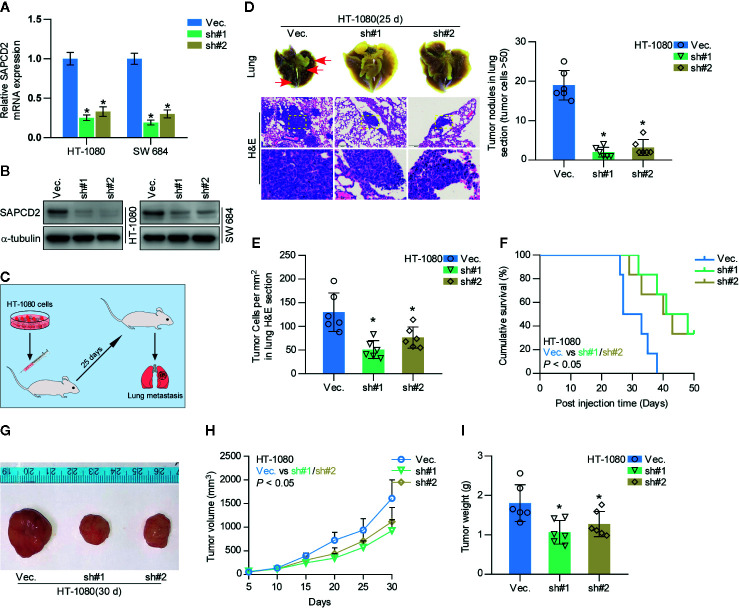
Figure 3.
Silencing SAPCD2 inhibits lung metastasis of fibrosarcoma cells in vivo. (A, B) Real-time PCR and Western blotting analysis of SAPCD2 expression in the indicated fibrosarcoma cells. GAPDH was used as endogenous controls in RT-PCR and α-Tubulin was detected as a loading control in the Western blot. Each bar represents the mean values ± SD of three independent experiments. *P < 0.05. (C) Schematic model illustrating the time and route of HT-1080 cell (vec. or SAPCD2-sh#1/2 stable cell lines) administration in a mouse model of lung metastasis. (D) Representative images of the lung metastases formed and hematoxylin-eosin staining from the indicated cells in the mice. The numbers of lung tumor nests in each group was counted under a low power field and are presented as the median values ± quartile values (right panel). *P < 0.05. (E) The quantification of the number of fibrosarcoma cells (per mm3) in the indicated tumor tissues. Error bars represent the mean ± SD values. *P < 0.05. (F) Kaplan-Meier survival curves from the indicated mice groups. (G) Images of excised tumors from the mice at 30 days after injection with the indicated cells. (H) Tumor volumes were measured every 5 days. Each bar represents the median values ± quartile values. (I) Average weight of excised tumors from the indicated mice. Each bar represents the median values ± quartile values. *P < 0.05.

