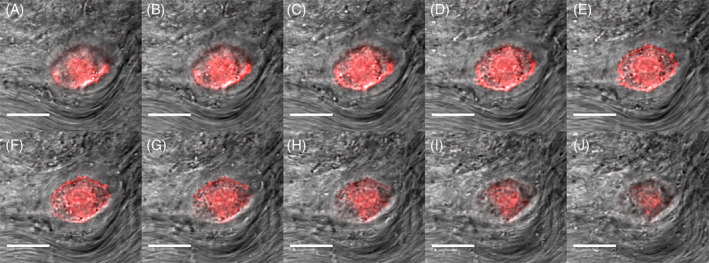
FIGURE 3.

Representative Z‐stack of a bovine nucleus pulposus cell in native tissue. A‐J, Bovine tissue was stained for F‐Actin (Phalloidin, red) and visualized with confocal microscope. DIC (gray) are overlaid. Sections are 1 μm apart. The native matrix can be appreciated in DIC images. Scale bars are 20 μm. Images were taken with a ×40 objective
