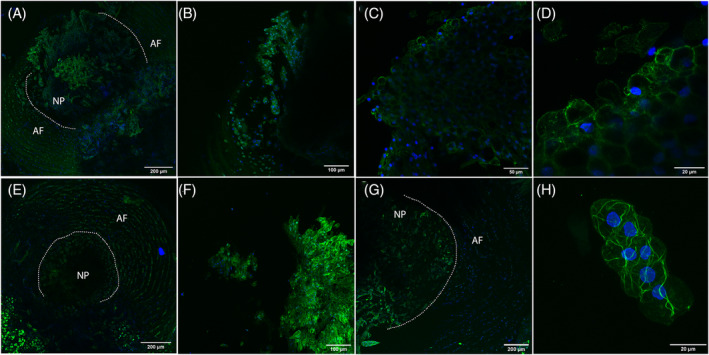
FIGURE 5.

Representative images of mice and rat IVDs. Tissues were fixed and stained with Phalloidin‐Alexa Fluor 488 for F‐Actin in green and DAPI for nuclei in blue. A, Maximum intensity projection of a young mouse NP and AF imaged with a ×10 objective, sections are 10 μm apart. B, Maximum intensity projection of a young mouse NP imaged with a ×20 objective, sections are 2 μm apart. C, Single image of a young mouse NP obtained with a ×40 objective. D, Zoom from image in (C). E, Maximum intensity projection of an adult mouse NP and AF imaged with a ×10 objective, sections are 5 μm apart. F, Maximum intensity projection of an adult mouse NP imaged with a ×20 objective, sections are 2 μm apart. G, Maximum intensity projection of an adult rat NP and AF imaged with a ×10 objective, sections are 10 μm apart. H, Maximum intensity projection of an adult rat NP imaged with a ×40 objective, sections are 2 μm apart. Scale bars are 200 μm for A, E, and G; 100 μm for B and F; 50 μm for C and 20 μm for D and H
