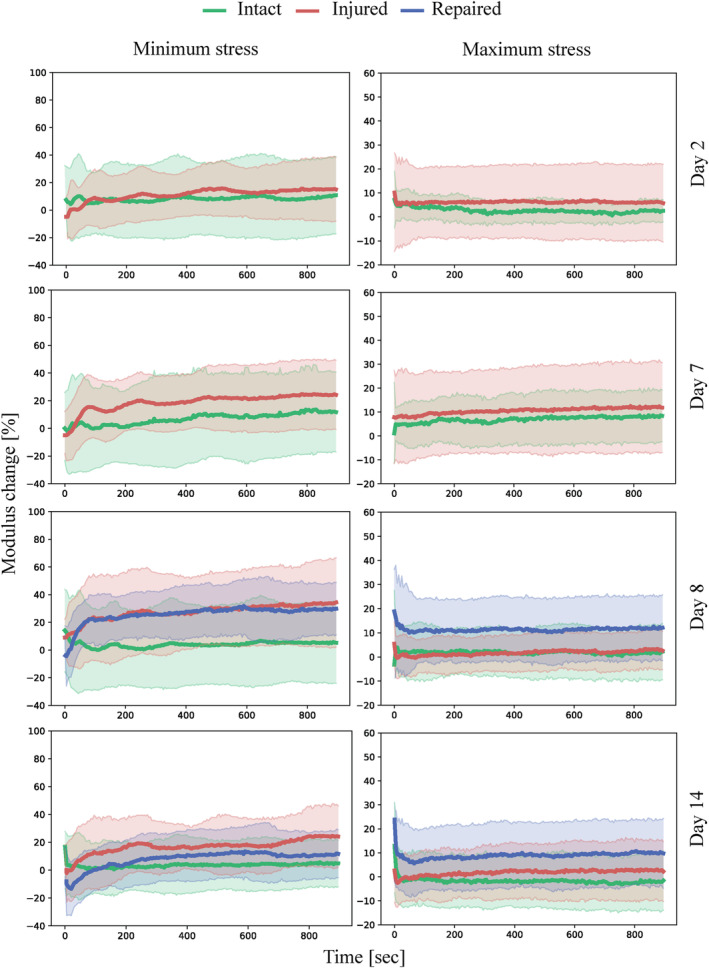
FIGURE 6.

Minimum stress and maximum stress plotted against time with shaded areas representing SD measured during cyclic (0.2 Hz) compressive loading of the samples in intact, injured and repaired states normalized to the values obtained from intact samples on day 0. n = 8
