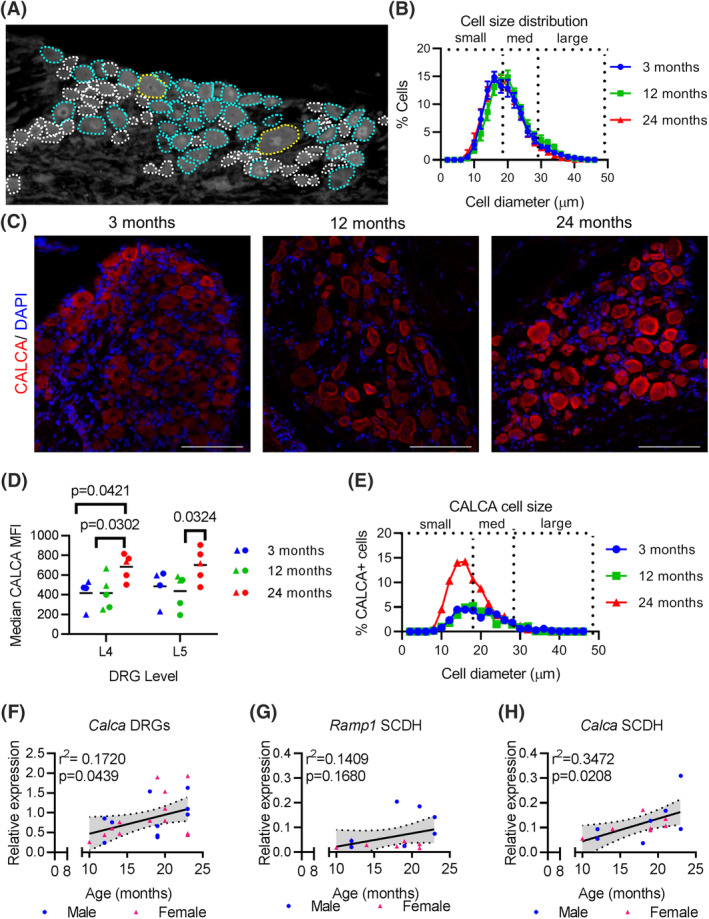
FIGURE 2.

CALCA is transcriptionally regulated in the DRGs and spinal cord of aging mice. A, Depiction of a DRG with small (white), medium (teal), and large (yellow) diameter neurons outlined. B, Proportional distribution of DRG cells by diameter in mice 3, 12, and 24 months. Dotted lines demarcate approximate boundaries of small, medium, and large‐diameter neurons. C, CALCA immunofluorescence in the L4/L5 DRGs of aging mice counterstained with DAPI. Scale bars, 100 μm. D, Median values of the mean fluorescent intensities (MFI) of cells within the L4 and L5 DRGs at indicated ages. Each point represents an individual animal. Black bars indicate group mean. E, Distribution of CALCA positive cells by cell size at indicated ages. F, qPCR analysis for Calca expression in L4‐L6 DRGs normalized to Gapdh compared with age in a linear regression. G, qPCR analysis for Ramp1 expression in the lumbar spinal cord dorsal horn (SCDH) normalized to Gapdh compared with age. H, qPCR analysis for Calca expression in lumbar SCDH normalized to Gapdh compared with Linear regression line (solid black line) and 95% CI (dotted lines) are based on both sexes combined. Each point in a graph represents a single biological replicate
