FIGURE 3.

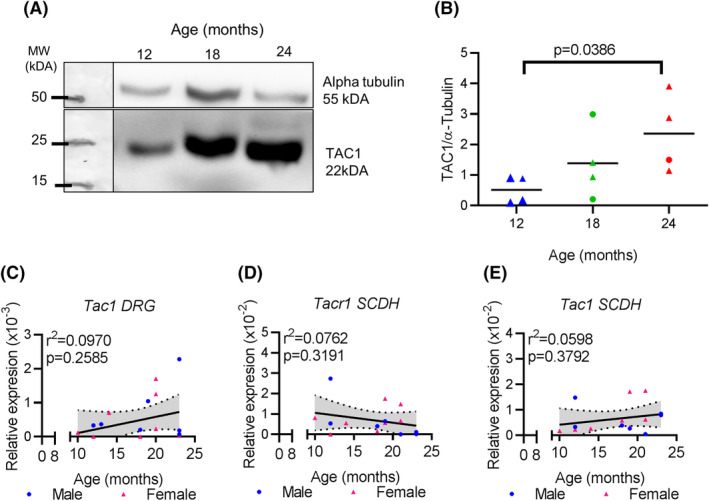
Aging DRGs have post‐transcriptional increased expression of TAC1. A, Representative Western blot showing TAC1 and alpha‐tubulin bands at indicated age. B, Quantification of four Western blots, using protein preparations from four different biological replicates, at indicated ages in the L4‐6 DRGs showing TAC1 normalized to alpha‐tubulin. C, qPCR analysis for Tac1 expression in L4‐L6 DRGs normalized to Gapdh at indicated ages. D, qPCR analysis for Tacr1 expression in lumbar SCDH normalized to Gapdh at indicated ages. E, qPCR analysis for Tac1 expression in lumbar SCDH normalized to Gapdh at indicated ages. Linear regression (solid black line) and 95% CI (dotted lines) are based on both sexes combined. MW, molecular weight. kDA, kilodaltons. Each point in a graph represents a single biological replicate
