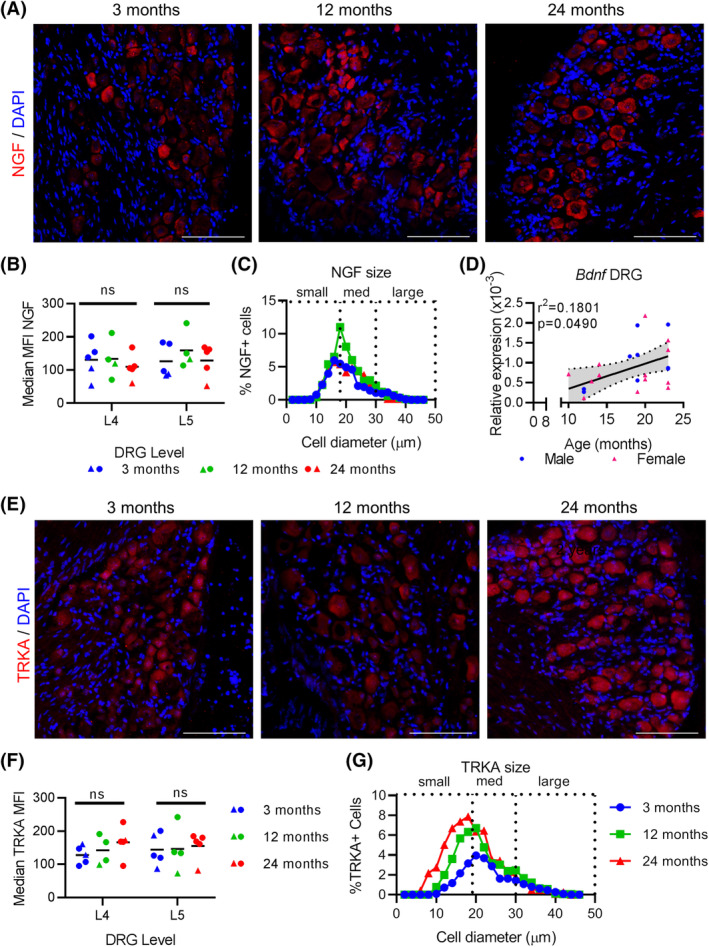
FIGURE 7.

Bdnf expression is increased with age in L4‐6 DRGs, but not NGF nor TrkA. A, Immunofluroescence of NGF in the L4/L5 DRGs at indicated ages with DAPI counterstained nuclei at indicated ages. Scale bar, 100 μm. B, Quantification of median MFIs of NGF in the L4/5 DRGs at indicated ages. Each point represents an individual animal. Black bars indicate group mean. ns, not significantly different. C, Relative distribution of NGF‐positive cells based on cell diameter at indicated age groups. D, qPCR analysis for Bdnf expression in L4‐L6 DRGs normalized to Gapdh at indicated ages. E, Immunofluorescence of TrkA in the L4/L5 DRGs at indicated ages with DAPI counterstained nuclei at indicated ages. Scale bar, 100 μm. Each point represents an individual animal. Black bars indicate group mean. F, Quantification of median MFIs of TrkA in the L4/5 DRGs at indicated ages. ns, not significantly different. G, Relative distribution of TrkA‐positive cells based on cell diameter at indicated age groups. Each point in a graph represents a single biological replicate
