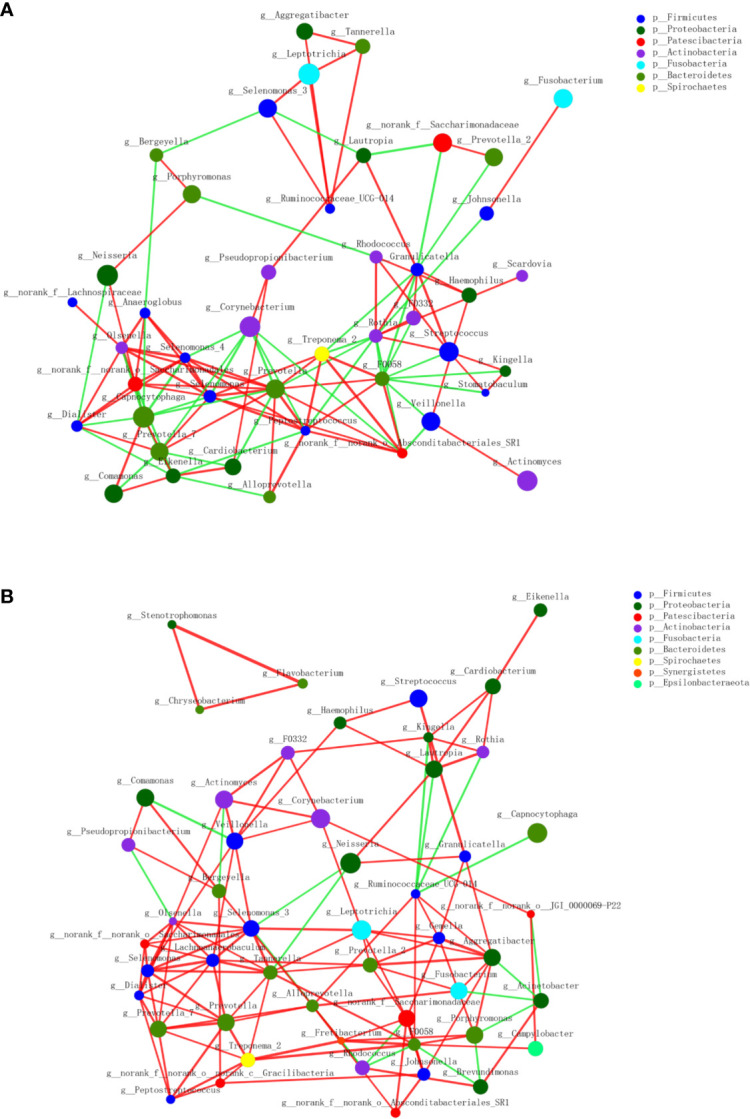
Figure 3.

Co-occurrence networks of the top 50 abundant genera in supragingival microbiota. The MAFLD group is shown in (A) and Health group in (B). The size of the node indicates the mean relative abundance of the corresponding genus. The same color represents genera belonging to the same phylum. The thickness of the connecting lines corresponds to the coefficient values (P < 0.05). The red and green lines indicate positive and negative correlations, respectively.
