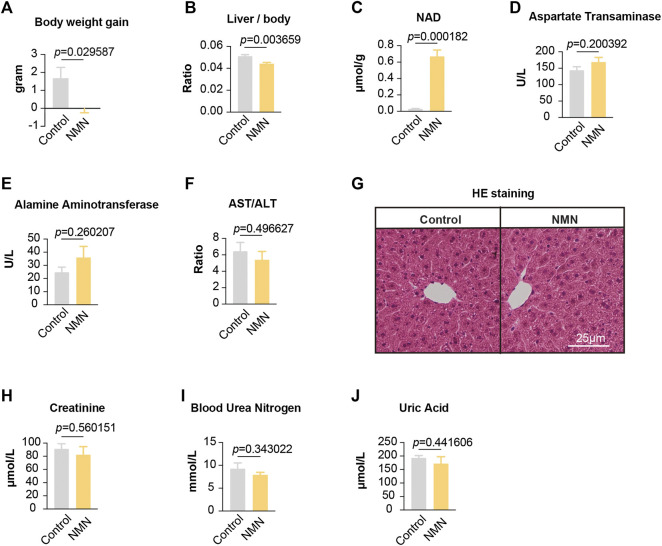
FIGURE 2.
Data for mice treated with NMN once per day (A)The body weight was decreased after NMN administration. (B) The ratio between liver weight and body weight was decreased after NMN administration (C) Liver NAD+ levels were increased after NMN administration. (D–F) Liver function was analyzed after NMN administration. (G) Photomicrograph of liver sections from NMN-administered mice exhibited normal hepatocytes (H&E stain). (H–J) Kidney function were analyzed after NMN administration.

