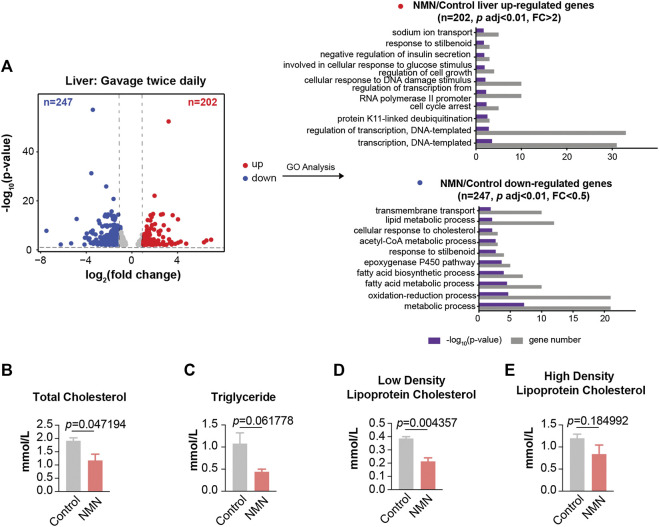
FIGURE 5.
Transcriptomic Analysis in 2680 mg/kg/d NMN-Administrated Mice Liver (A) Volcano plot shows that genes are differentially expressed in 2680 mg/kg/d NMN-administrated mice compared to control in liver (left panel). Differential expression analysis was performed by DESeq2 from three biological replicates. 202 genes were found to be upregulated (p < 0.01, FC > 2), 247 genes were down regulated (p < 0.01, FC < 0.5). Gene ontology (GO) analysis were performed by David (right panel). The result shows lipid metabolic process being the biological processes significantly enriched for genes down regulated in 2680 mg/kg/d NMN administration group. The bar graphs represent–log10 (p value) and gene counts in each pathway. (B–E) Blood lipids were measured after 2680 mg/kg/d NMN administration. (B) Total Cholesterol was decreased in 2680 mg/kg/d NMN-administered mice. (D) Low density lipoprotein cholesterol was decreased in 2680 mg/kg/d NMN-administered mice.

