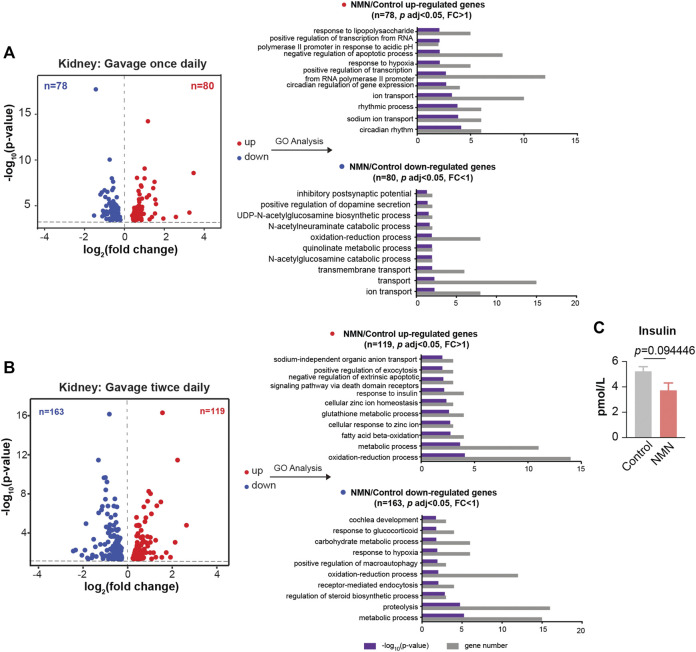
FIGURE 6.
Transcriptomic Analysis in NMN Administrated Mice Kidney. (A) Volcano plot shows that genes are differentially expressed in 1340 mg/kg/d NMN-administrated mice compared to control in kidney (left panel). Differential expression analysis was performed by DESeq2 from four biological replicates. 80 genes were found to be upregulated (p < 0.05, FC > 1), 79 genes were down regulated (p < 0.05, FC > 1). Gene ontology (GO) analysis were performed by David (right panel). (B). Volcano plot shows that genes are differentially expressed in 2680 mg/kg/d NMN-administrated mice compared to control in kidney (left panel). Differential expression analysis was performed by DESeq2 from three biological replicates. 119 genes were found to be upregulated (p < 0.05, FC > 1), 163 genes were down regulated (p < 0.05, FC < 1). Gene ontology (GO) analysis were performed by David (right panel). Gene ontology (GO) analysis (performed by David) shows response to insulin being the biological processes significantly enriched for genes down regulated in 2680 mg/kg/d NMN administration group. (C) The insulin level in serum was measured after NMN administration.

