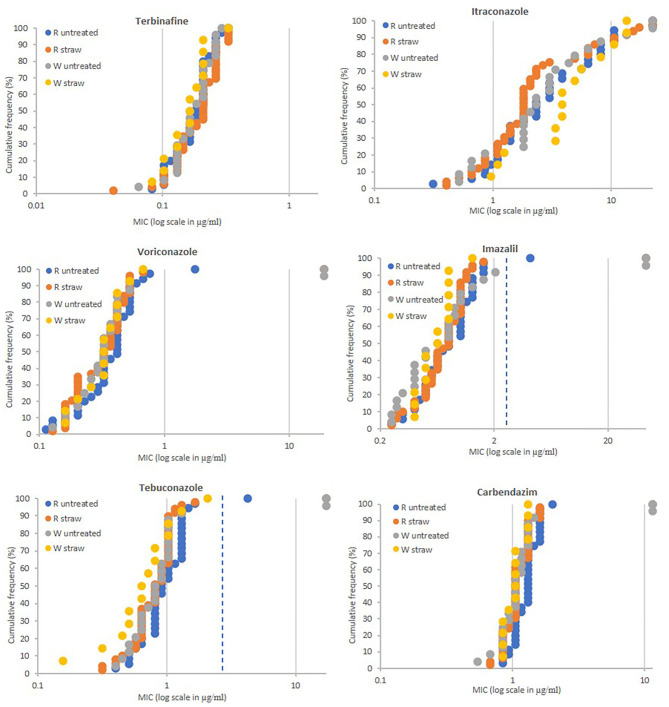
Figure 2.
Fungicide sensitivity profiling of A. fumigatus populations sampled from soils of the Long-term Amounts of Straw Experiments at the Rothamsted (n = 84) and Woburn farms (n = 38). MIC values of individual isolates (X-axis in ppm) are plotted against the proportion of the population (Y-axis in %). Populations from Rothamsted (R) with straw incorporation (straw) (n = 49) and without straw (untreated) (n = 35) and Woburn (W) with straw incorporation (straw) (n = 14) and without straw (untreated) (n = 24). MIC values (μg/ml) for highly resistant isolates to itraconazole (>22.324), voriconazole (>19.120), imazalil (>43.153), tebuconazole (>17.349), and carbendazim (>11.464), and sensitive to imazalil (<0.25) are displayed as 22.324, 19.120, 43.153, 17.349, 11.464, and 0.25, respectively. Extra dotted line for imazalil and tebuconazole show cut-off values of 2.5 and 3.0 ppm, respectively.

