Abstract
Lusaka, Zambia, is a rapidly growing city located on a vulnerable karstic dolomite aquifer that provides most of the city's drinking water. Over 65% of residents live in peri‐urban communities with inadequate sanitation leading to widespread groundwater contamination and the spread of waterborne diseases such as cholera. To fill the water service gap, Water Trusts were created: public/private partnerships designed to provide clean water to peri‐urban community residents. Water Trusts extract groundwater via boreholes, treat it with chlorine, and distribute it to residents via public kiosks. We investigated the efficacy of drinking water provision to residents in six of Lusaka's peri‐urban communities with Water Trusts. Water samples were collected from Water Trust boreholes and kiosks, privately owned boreholes, and shallow wells during four sampling efforts. To assess potential risk to human health, water samples were analyzed for Escherichia coli (E. coli) and nitrate. Shallow wells were significantly more contaminated with E. coli than Water Trust boreholes, kiosks, and private boreholes (Tukey‐adjusted p values of 9.9 × 10⁻⁶). Shallow wells and private boreholes had significantly higher nitrate‐N concentrations (mean of 29.6 mg/L) than the Water Trust boreholes and kiosks (mean of 8.8 mg/L) (p value = 1.1 × 10⁻⁴). In 2016, a questionnaire was distributed to Water Trust managers to assess their ability to meet demands. In the six communities studied, Water Trusts served only about 60% of their residents. Water Trusts provide a much safer alternative to shallow wells with respect to nitrate and E. coli, but they struggle to keep pace with growing demand.
Keywords: Water Trusts, groundwater contamination, karst hydrogeology, water quality, peri‐urban communities, Lusaka
Key Points
Water from private boreholes and shallow wells contains high concentrations of nitrate and, for shallow wells, also Escherichia coli
Water Trusts provide an improved public water supply relative to other sources; however, 16% of samples from kiosks had detectable Escherichia coli
Nearly 40% of peri‐urban residents choose not to or cannot access Water Trust water, instead relying on private boreholes or shallow wells
1. Introduction
Reliable access to safe drinking water is critical for maintaining and improving human health and quality of life throughout lower‐ and middle‐income countries. Throughout Africa, groundwater resources are often more available, dependable and less vulnerable to pollution than surface water; groundwater therefore represents the largest and most important water resource in Africa (Lapworth et al., 2017). This is especially true in drought‐prone areas of Africa where climate variability is likely to increase in the future (Lapworth et al., 2017). Water supply and pollution issues are becoming more severe in African urban centers. The percentage of the population living in cities of 500,000 people or more is increasing throughout the world, but nowhere faster than in Africa where the current growth rate is about 3.5%. The urban population of Africa was about 824 million in 2018 and is expected to reach about 1.5 billion by 2030 (UNDESAPD, 2019). This rate of urbanization exceeds the capacity of many African cities to provide adequate infrastructure (Adelana et al., 2008), and this has led to an increased demand for water that is not matched by an equal increase in safe water supply, sanitation, and waste disposal services.
Throughout sub‐Saharan Africa, many of the expanding urban areas are dependent on groundwater for the major of their domestic water supply (Adelana et al., 2008). Adelana et al. (2008) identified 49 cities in Africa heavily dependent on groundwater resources. The high and growing population densities in many of these urban and peri‐urban centers has led to groundwater supply and pollution issues. Addis Ababa, Ethiopia, for example, has a supply shortfall of about 50%. Many cities are facing aquifer depletion at rates of between 0.13 and 0.5 m/yr. Coastal cities like Lagos, Nigeria, Dakar, Senegal and Cape Town, South Africa all deal with saltwater intrusion due to over‐abstraction of their groundwater supplies.
In most cities throughout Africa, anthropogenic contamination of groundwater occurs due to industrial discharge and untreated sewage. Groundwater contamination is especially problematic where unimproved sanitation facilities, mainly pit latrines, are in close proximity to wells and springs (Lapworth et al., 2017). Aquifer contamination in dense urban areas can also occur from leaking septic tanks, soak pits and sewage lines (Adelana et al., 2008; Adelana & MacDonald, 2008). This can be especially problematic where people are dependent on untreated surface water or untreated water from private shallow wells, particularly susceptible to contamination from on‐site sanitation and waste disposal (Adelana et al., 2008; Adelana & MacDonald, 2008). Due to their shallow depth and location in urban areas (sometimes near pit latrines, waste ditches, and industrial areas) these well are vulnerable to bacteria, nutrients, and heavy metals contamination (Bäumle & Kang'omba, 2012; Chande & Mayo, 2019). Water quality from shallow wells in sub‐Saharan cities such as Dakar, Senegal, Lagos, Nigeria, and Lusaka, Zambia are contaminated with high levels of nitrates (exceeding WHO guidelines) because they sit on vulnerable aquifers that have been contaminated by human activities (Adelana et al., 2008). In some parts of Lusaka, the aquifer is also contaminated with bacteria and is classified as vulnerable to pollution (Adelana et al., 2008; Chande & Mayo, 2019). In Kabwe, Zambia, a variety of bacterial biomarkers, including Vibrio cholerae, were detected in urban groundwater samples using PCR (Sorensen et al., 2015). Liddle et al. (2015), on the other hand, found that the town of Ndola in Zambia had widespread usage of shallow wells that met the World Health Organization (WHO) safe guidelines for both coliform and metals. The study concluded that shallow wells if properly located (in the right geological units) and managed can provide safe drinking water. Liddle et al.'s study showed that rocks with lower permeability are good for digging shallow wells for drinking water supply. These findings show that more research is needed on the groundwater quality and management in urban and peri‐urban areas of cities in less industrialized nations such as Zambia. Lapworth et al. (2017) stated that the vulnerability of groundwater to anthropogenic contamination in sub‐Saharan African urban centers has not received enough attention and that more data are needed to develop proper groundwater management and policy.
Lusaka, the capital of Zambia, is a rapidly growing city in south central Africa with a population of over 2 million people (CSO, 2012). Lusaka's population growth is partially driven by migration from rural areas by individuals in search of employment and a better way of life (De Waele et al., 2004). Insufficient housing and inability of rural migrants to pay rent has given rise to rapidly expanding unplanned, peri‐urban developments around the capital city. Some of these communities were originally constructed during the colonial period to segregate native populations from colonialists. Presently, over 60% of Lusaka's population lives in these unplanned, peri‐urban settlements, which have poor access to primary services including water, trash collection, electricity, and sewage (De Waele & Follesa, 2003). Due to increasing population size and poor sanitation the region is faced with many water quality and quantity challenges.
Continued rural migration to urban centers has led to the rapid growth of high‐density, informal settlements making it difficult for Lusaka authorities and the Lusaka Water and Sanitation Company (LWSC) to keep up with demand for water and sanitation services. After implementation of the 1994 National Water Policy, private investors and non‐government organizations (NGOs) began to supplement services provided by the LWSC. Cooperative for Assistance and Relief Everywhere (CARE) International, an NGO, was invited by the government of the Republic of Zambia to help address water provision in peri‐urban communities (Kadimba‐Mwanamwambwa et al., 2005). CARE sought to improve living situations for low‐income residents by increasing community involvement, improving the status of women, updating physical infrastructure and assisting the LWSC in providing water and sanitation to peri‐urban communities (Kayaga & Kadimba‐Mwanamwambwa, 2006). Working closely with the Lusaka City Council and the LWSC, CARE developed the Water Trust model to create independent, sustainable water supply systems that could be managed by community members (Kadimba‐Mwanamwambwa et al., 2005; Kayaga & Kadimba‐Mwanamwambwa, 2006).
The Water Trust model was implemented in several peri‐urban communities surrounding Lusaka (Kadimba‐Mwanamwambwa et al., 2005). Initially, CARE supplied all necessary equipment and trained community members who later took full control of all aspects of management and service delivery (Franceys & Gerlach, 2005). A tiered community management system was formulated to ensure continuation of the project (Kadimba‐Mwanamwambwa et al., 2005). Water Trusts extract groundwater via boreholes located throughout the peri‐urban communities. Boreholes obtain water from aquifer depths that are less likely to be affected by surface and near surface contamination. After extraction, the water is treated with chlorine, stored in elevated storage tanks, and distributed through underground pipes to public tap stands (also known as kiosks) where it is sold to residents at a cost of about $0.04 per 20 L containers (according to the Water Trust managers in 2016).
The purpose of this research was to investigate the water quality in Lusaka's peri‐urban communities and to assess the efficacy of the provision of clean drinking water to residents of those communities by the Water Trusts. For characterizing water quality, we chose to focus on Escherichia coli (E. coli) and nitrate, both potential indicators of fecal contamination, the largest source of contamination in both urban and rural groundwater in Africa, especially in high‐density areas with poor sanitation (Lapworth et al., 2017). Waterborne bacterial pathogens are a major threat to public health throughout lower and lower‐middle‐income countries (Sorensen et al., 2015). Recent cholera epidemics in this area highlight the risks associated with fecal contamination of drinking water (Sladoje, 2018). Nitrate is also a widely used proxy for anthropogenic contamination from a variety of sources.
Specific hypotheses and research objectives included the following:
We hypothesize that there are substantial water quality differences among the various type of water sources available in the peri‐urban communities. We evaluated the water quality of the different sources of drinking water in six peri‐urban communities by comparing the concentrations of E. coli and nitrate in the treated water emanating from the Water Trust boreholes and the alternative, untreated water from private boreholes and shallow, hand‐dug wells;
We hypothesize that water quality parameters are correlated. These correlations might indicate whether using less‐expensive water quality measures, like specific conductance, can be used as a trigger for more involved water quality testing.
We hypothesize that Kanyama has more severe water quality issues than the other communities. Kang'omba and Bäumle (2013) used underlying geology, soil type, and soil thickness to make a map of groundwater vulnerability. One of the peri‐urban communities, Kanyama, was located in an area described as “Extreme Vulnerability.” We compared the water quality in Kanyama to the other five communities as a check on the usefulness of this map.
Based on the estimates of the Water Trust managers, we assessed the degree to which residents in these peri‐urban communities used the Water Trust water.
2. Background
2.1. Water Use and Waterborne Disease in Lusaka
Water use in Lusaka is approximately 450,000 m3 per day, 78% of which comes from groundwater resources, extracting the rest from the Kafue River, about 51 km south of Lusaka (De Waele et al., 2004; Museteka & Bäumle, 2009). Groundwater is obtained through 40 municipal wells that are supplemented by over 3,000 privately owned boreholes. Lusaka sits atop a crystalline dolomite and limestone karst aquifer (Kang'omba & Bäumle, 2013). Karst groundwater systems comprise dissolution channels and fissures that allow for accelerated transport of water.
Accelerated water transport allows rapid transit of contaminants making karst systems highly vulnerable to pollution. Unconfined waste pits, pit latrines, septic tanks, and industry are potential sources of contamination, especially when they are in contact with bedrock outcrops or open water surfaces such as quarries. The vulnerable nature of the aquifer has led to widespread contamination of Lusaka's groundwater with bacteria, nitrates, ammonium (De Waele & Follesa, 2003; Museteka & Bäumle, 2009; Nkhuwa, 1996; Nyambe, 2000), sulfate, chloride (Museteka & Bäumle, 2009), and mercury (De Waele et al., 2004). Excess nitrate in drinking water has been associated with methemoglobinemia (blue baby syndrome) and other developmental issues in infants (Fan et al., 1987). E. coli bacteria are indicators of fecal contamination, which can lead to waterborne diseases such as dysentery, typhoid, and cholera. According to the World Health Organization, in water intended for drinking, there must not be any detectable E. coli bacteria in any 100 ml water sample (WHO, 1997).
Indeed, cholera epidemics in Zambia have been frequent since 1990, occurring in 1991, 1993, 1999, 2004, 2009, 2010, 2016, and 2017 with the number of deaths totaling 4,731 (Sladoje, 2018). Cholera and other waterborne diseases are associated with fecally contaminated drinking water and poor sanitation infrastructure (Lapworth et al., 2017; Sorensen et al., 2015). The most recent cholera outbreak in Zambia began in October 2017 and was concentrated in the peri‐urban communities of Lusaka, starting in Chipata and spreading to Kanyama (Sladoje, 2018) as well as Garden, Ngombe, Mazyopa, and Chazanga (IFRCRCS, 2018). The outbreak resulted in 5,414 cases and 98 deaths of Lusaka residents between 4 October 2017 and 12 May 2018 (Sinyange et al., 2018).
In peri‐urban communities in Lusaka, cholera cases have been associated with lack of household latrines, limited safe water sources and lack of personal hygiene practices (Sasaki et al., 2008) as well as insufficient coverage of storm runoff drainage networks (Sasaki et al., 2009) resulting in substantial flooding. Waterborne diseases have been directly linked to the consumption of drinking water from shallow wells (Sasaki et al., 2008). Shallow wells, common to peri‐urban communities, are created by digging through the top layer of substrate until groundwater is reached. Untreated groundwater is then collected and often consumed by residents of these communities. During the cholera outbreak of 2017–2018, 220 drinking water sources were randomly chosen and tested. Of the shallow wells tested, 91% tested positive for E. coli but so did 34% of the tested boreholes (Sinyange et al., 2018). These findings suggest that those who use shallow wells are at greater risk for waterborne diseases; however, boreholes, including those run by the Water Trusts, are not necessarily free of bacterial contamination. The Zambia Red Cross Society took many actions in response to the 2017–2018 outbreak including ensuring that residents acquired safe water from protected sources. They observed that some residents of the peri‐urban communities were drawing water from shallow wells and joined the government ministries in providing more access to public taps, kiosks, and municipal water tanks. According to Water Trust managers, many shallow wells throughout the area were buried to prevent further spread of disease; however, by June 2019, many residents had dug new shallow wells. It is currently unknown whether the shallow wells were the only source of drinking water that was responsible for the spread of cholera or whether private boreholes were also to blame.
2.2. Geology and Hydrogeology of the Study Area
Lusaka sits on a plateau about 1,280 m above sea level (Bäumle & Kang'omba, 2012). The city area is underlain by a thick sequence of metasedimentary rocks of the Katanga Supergroup (Figure 1) (Maseka & Nyambe, 1999; Mpamba et al., 2008). The lowest geological unit is the Chunga Formation that comprises crystalline rock of low permeability. The overlying Cheta Formation comprises schist and quartzite but with some more permeable dolomitic limestone, which is used to a limited extent as a water source (Nyambe, 2000). The uppermost Lusaka Formation is a dolomitic limestone and marble unit. With its integrated system of dissolution conduits that follow joint planes and sheet fissures, it is the primary aquifer for Lusaka. Some of these features have great lateral extents in the subsurface which boreholes have intersected at depths at and below 60 m (Adelana et al., 2008). Groundwater withdrawal from the aquifer has led to a progressive decline in the water table elevation (Adelana et al., 2008). The Lusaka Formation has a cutter‐and‐pinnacle, epikarst topography at the surface extending to a depth of 25 m (Figure 2) (Nkhuwa, 2003). Water levels are shallow; depths generally range throughout the area from 6 to 15 m. The principal recharge area is the Lusaka Forest Reserve, southwest of Lusaka, an area undergoing rapid deforestation and settlement development including the Lusaka Economic Zone. There is also substantial localized recharge from sources such as overflowing sewers, adding to the public health risk (Karen et al., 2019). Groundwater recharge occurs primarily from November to April averaging 186 mm/yr, which is 27% of the annual rainfall (De Waele & Follesa, 2003; Nyambe, 2000). Groundwater flow is generally southeast to northwest through Lusaka with branches of flow to the northeast and southwest (Mpamba et al., 2008; Museteka & Bäumle, 2009; Von Hoyer et al., 1978). These general, large‐scale flow directions, however, are not definitive in a karstic system. Groundwater discharge occurs along the schist‐dolomite contact through numerous intermittent springs and in low‐lying swampy areas (dambos) (Museteka & Bäumle, 2009).
Figure 1.
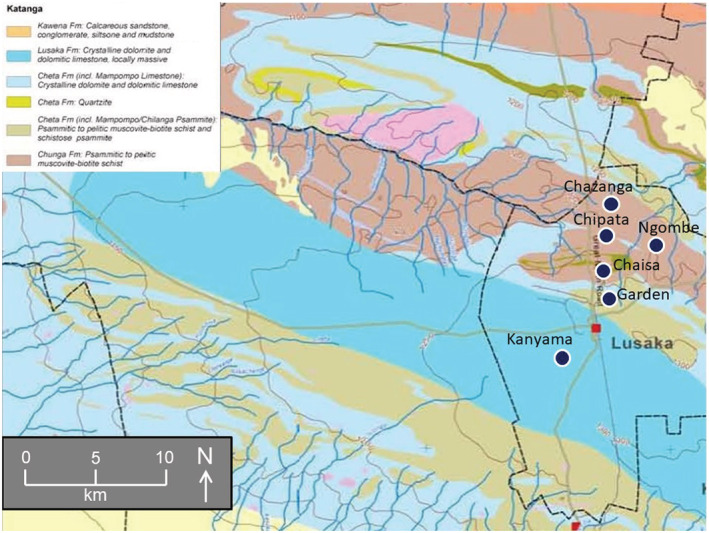
Generalized geology of the Lusaka area, Zambia (Bäumle & Kang'omba, 2012). The six Water Trust communities investigated are shown.
Figure 2.
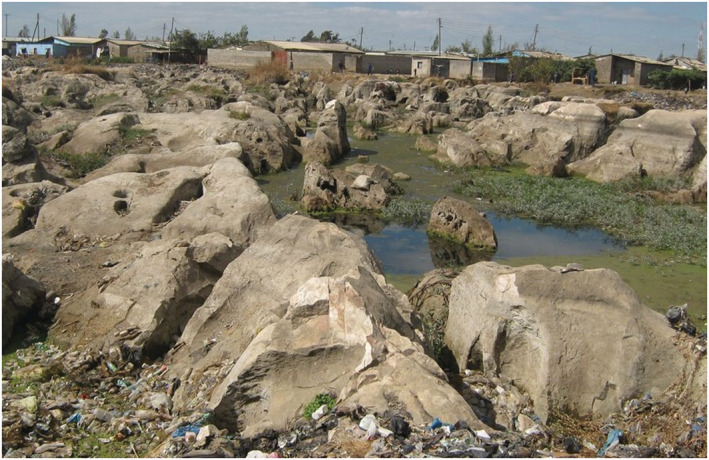
Exposed epikarst near Kanyama where the soil has been stripped away to expose underlying marble for extraction of construction aggregate, Lusaka, Zambia.
Based on the underlying geology, soil type and soil thickness, Kang'omba and Bäumle (2013) assigned groundwater contamination vulnerability classes to the study area (Figure 3). Most of the area associated with the Lusaka Formation was designated as extremely vulnerable to groundwater pollution. Of great concern is that pit latrines and drinking water sources may be directly connected via highly conductive karst conduits, a situation which can lead to bacterial and nitrate contamination and the spread of waterborne disease.
Figure 3.
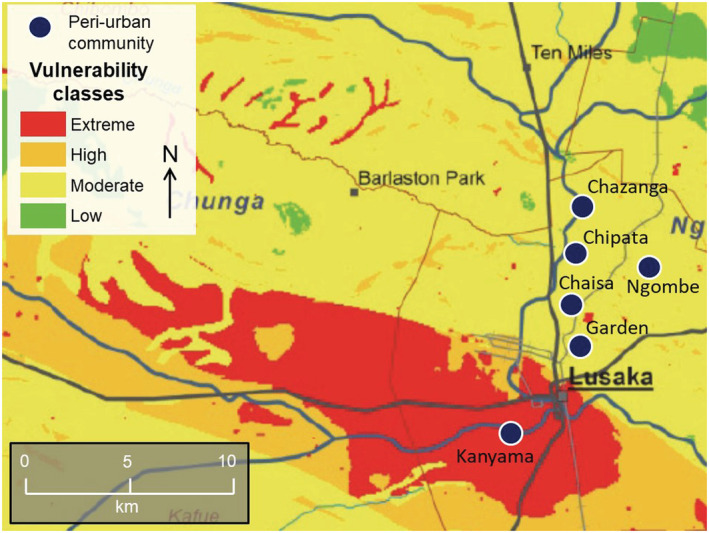
Groundwater vulnerability map of Lusaka, Zambia. From Kang'omba and Bäumle (2013).
2.3. Peri‐Urban Communities
Six peri‐urban communities were selected for this study based on presence of Water Trusts, population size and hydrogeological properties. Located to the north of Lusaka are Chaisa, Chazanga, Chipata, and Garden. Ngombe is located to the northeast of Lusaka and Kanyama to the southwest (Figure 1). Population size ranged from approximately 35,000 residents in Garden to 350,000 in Kanyama. All but one of the peri‐urban communities overlay the Chunga and Cheta formations, areas denoted as moderately vulnerable to groundwater contamination by Kang'omba and Bäumle (2013). Kanyama is centrally located atop the Lusaka Formation and has been denoted extremely vulnerable to groundwater contamination (Table 1) (Kang'omba & Bäumle, 2013). The depth to water and total depths of shallow wells were only consistently measured in 2013 and 2014 in Chaisa and Kanyama. Depths to water ranged from 0.72 to 4.21 m and averaged 2.43 m. The total depths of the wells ranged from 1.9 to 5.98 m and averaged 3.88 m. Within the six peri‐urban communities, Water Trust managers reported a total of 19 municipal boreholes ranging in depth from 50 to 80 m. Eleven of these were reported as 60 m deep. No information could be found regarding the depths of the private boreholes sampled.
Table 1.
Hydrogeological Generalizations for the Six Peri‐urban Communities, Lusaka Area, Zambia
| Community | Population a | Formation b | Rock type c | Vulnerability class d | Aquifer classification c |
|---|---|---|---|---|---|
| Kanyama | 300,000 | Lusaka | Crystalline dolomite and dolomitic limestone | Extreme | Highly productive |
| Chaisa | 42,000 | Chunga | Psammitic to pelitic schist | Moderate | Limited water resource |
| Garden | 35,000 | Cheta | Crystalline dolomite and dolomitic limestone | Moderate | Mixed highly and moderately productive |
| Chipata | 89,000 | Chunga | Psammitic to pelitic schist | Moderate | Limited water resource |
| Chazanga | 112,000 | Chunga | Psammitic to pelitic schist | Moderate | Limited water resource |
| Ngombe | 110,000 | Chunga | Psammitic to pelitic schist | Moderate | Limited water resource |
3. Materials and Methods
3.1. Water Sampling Locations and Sources
Water samples were collected from 77 unique sites throughout six communities: Chaisa, Chazanga, Chipata, Garden, Kanyama and Ngombe. Spatial location coordinates were recorded for each site with a handheld GPS unit. A total of 114 samples were taken during four sampling efforts in June 2013, January 2014, June/July 2016 and June 2019 (Figure 4). Although the collection over several years was not ideal, no changes over time to the methods of water provision and treatment were noted. Rather than a single snapshot in time, the results represent average conditions over a 6 yr period. In total, water samples were collected from 16 Water Trust boreholes, 23 kiosks linked to Water Trust boreholes, 27 shallow hand‐dug wells and 11 privately owned boreholes. Some sites were sampled repeatedly, while others were only sampled once. Which water sources were tested year to year depended on the preferences of the Water Trust Managers. In total, 114 samples were taken as broken down in Table 2 by source type, sampling round, and community.
Figure 4.
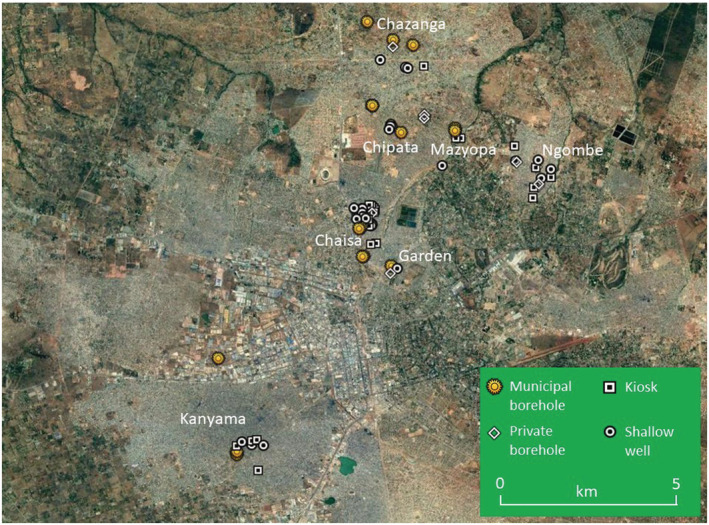
Map of the 77 sample sites that span six peri‐urban communities near Lusaka, Zambia during four sampling efforts (June 2013, January 2014, June/July 2016, and June 2019).
Table 2.
Water Sampling Designated by Sampling Year, Community, and Type of Water Source, Lusaka Area, Zambia
| Community | Jun‐2013 | Jan‐2014 | June/July 2016 | Jun‐2019 | Total | ||||||||||
|---|---|---|---|---|---|---|---|---|---|---|---|---|---|---|---|
| MBH a | KSK b | SW a | MBH | KSK | SW | MBH | KSK | SW | PBH b | MBH | KSK | SW | PBH | All sources | |
| Chaisa | 2 | 1 | 4 | 2 | 3 | 5 | 1 | 4 | 6 | 0 | 4 | 6 | 5 | 1 | 44 |
| Kanyama | 2 | 2 | 2 | 6 | 3 | 3 | 2 | 4 | 2 | 0 | — | — | — | — | 26 |
| Garden | — | — | — | — | — | — | 1 | 0 | 1 | 1 | — | — | — | — | 3 |
| Chipata | — | — | — | — | — | — | 3 | 0 | 4 | 3 | — | — | — | — | 10 |
| Chazanga | — | — | — | — | — | — | 3 | 1 | 3 | 1 | — | — | — | — | 8 |
| Ngombe/Mazyopa | — | — | — | — | — | — | 2 | 4 | 2 | 2 | 1 | 5 | 4 | 3 | 23 |
| Total | 4 | 3 | 6 | 8 | 6 | 8 | 12 | 13 | 18 | 7 | 5 | 11 | 9 | 4 | 114 |
SW is shallow well.
PBH is private borehole.
MBH is municipal borehole.
KSK is public kiosk or tap stand.
Water Trust water was represented by water from municipal boreholes and the kiosks. At municipal boreholes, 21 samples were taken after chlorination (Figure 5); these samples represented the stored water, which was then gravity fed to the kiosks (Figure 6). When comparing water among sources, only the chlorinated municipal borehole water was used; therefore, all Water Trust water considered here was treated. Six samples were taken from municipal boreholes before chlorination but were not used in the statistical analyses. The comparison of kiosk water and chlorinated municipal borehole water indicates whether any significant contamination occurred between the treating of the water and delivery at the kiosks. Shallow wells and private boreholes represent untreated, non‐Water Trust water. In shallow wells, depth to water was recorded with a Solinst® water tape, and then samples were taken using the same equipment used by the residents to withdraw water, usually a bucket on a rope (Figure 7).
Figure 5.
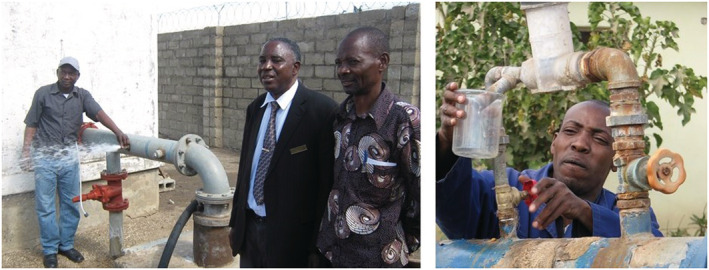
Examples of sampling at Water Trust boreholes.
Figure 6.
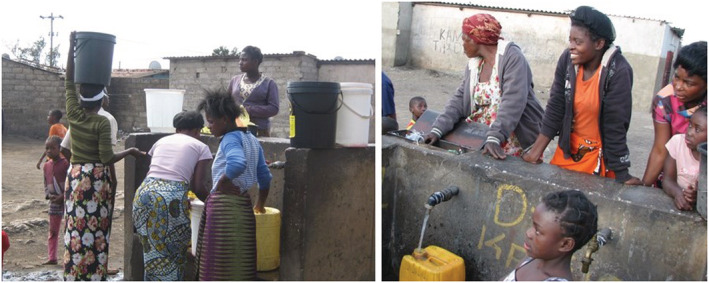
Examples of obtaining water at Water Trust kiosks (public tap stands).
Figure 7.
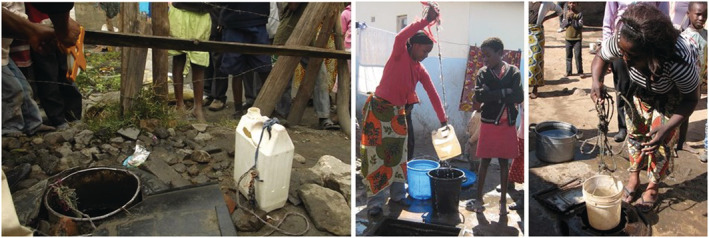
Examples of obtaining water at shallow wells.
3.2. Water Analyses and Quality Assessment
At all sampling locations, the water temperature, pH, dissolved oxygen and specific conductance were measured with a YSI® 600XLM multiparameter data sonde (2013, 2014, 2016) or an In‐Situ® Aqua TROLL 600 multiparameter data sonde (2019). Specific conductance can be a general indicator of contamination. Unpolluted groundwater from karst systems normally has a specific conductance of less than 800 μS/cm (Museteka & Bäumle, 2009), and the Zambian maximum limit for drinking water is 1,500 μS/cm (ZABS, 2010). For shallow wells, the data sonde was dropped into the well for direct measurements. To assess potential risks to human health, the water samples were analyzed for E. coli bacteria and nitrate (NO3). Bacteria and nitrate were selected because they are commonly associated with urban sewage, diarrheal diseases such as cholera and typhoid, and developmental diseases in infants (i.e., blue baby syndrome).
For bacterial analysis, about 250 ml of water was collected in Whirl‐Pak® bags and stored on ice while in the field. Latex gloves were worn during the sampling and sample analyses. Samples were analyzed for E. coli the same day they were collected. Most analyses used membrane filtration in which 100 ml samples and were pulled through a 0.45 μm filter using a sterile vacuum filtration device. The filter was then placed in either a sterile‐padded Petri dish with m‐ColiBlue24® broth or in a 3 M® Petrifilm E. coli/Coliform Count Plate pre‐wet with 1 ml of sterile water. For samples that we suspected were highly contaminated, 1 ml of sample water was placed directly on a 3 M Petrifilm®. All samples were incubated at 35°C for 24 h, and then colony‐forming units (CFUs) were counted. In cases where the number of CFUs exceeded 200, they were denoted as too numerous to count (TNTC). If multiple samples were collected at a given site during the same sampling event, these values were averaged. Bacteria concentrations were then calculated in units of CFU/100 ml for all samples. Although formal blanks were not taken, the vast majority of samples from kiosks and municipal boreholes were free of E. coli confirming our ability to avoid contamination.
Water samples were collected for nitrate analyses in 50 ml low‐density polyethylene bottles stored at 4°C until analysis. For analysis, samples were brought back to Miami University in the United States. In 2013 and 2014 nitrate analyses were performed on Miami University's Dionex 500X ion chromatography instrument using an IonPac AS23 analytical anion exchange column with an IonPac AG23 guard column and using a 4.5 mM Na2CO3‐0.8 mM NaHCO2 eluent. In 2016 and 2019, nitrate concentrations were measured at Miami University's Center of Aquatic and Watershed Sciences by cadmium reduction using a Lachat QuickChem 8,500 Series 2 DIA system, method number 10‐107‐04‐1‐A (Wendt, 2000). Samples were a mix of both filtered and unfiltered water. In 2019, filtered and unfiltered samples from two sources were analyzed independently, and concentrations differed by a maximum of 0.08 mg/L. Duplicate samples from three sources were analyzed independently, and concentrations differed by a maximum of 0.19 mg/L. All concentrations are given as mg/L nitrate as nitrogen (NO3‐N) and rounded to two significant digits.
3.3. Water Trust Managers Survey
In June and July 2016, a 26‐question survey was created for Water Trust Managers in the six peri‐urban communities to try to assess how well they were doing in actually distributing water to their populations and what the impediments might be to providing water to more people. The survey followed the Institutional Review Board standards at Miami University and was created using Qualtrics software. The survey was divided into five sections: (1) Water Trust Supply, (2) Water Trust Structure and Employees, (3) Public Choices, (4) Perceptions of the Water, and (5) Connection to Disease. A paper‐based copy of the survey was distributed to the six Water Trusts in June–July 2016 and results were later compiled for analysis. Survey questions can be found in the supporting information Data Set S4.
3.4. Statistical Analyses
To test for differences among populations, analysis of variance (ANOVA) tests were conducted (Snedecor & Cochran, 1980). Kolmogorov‐Smirnov normality tests were applied to all water quality data (E. coli, nitrate and specific conductance). In all cases, the null hypothesis, that the data were normally distributed, was rejected. In addition, bacterial data were highly variable and only semi‐quantitative, especially at high concentrations. Because of inconsistencies in nitrate filtration and times between collection and analyses, nitrate results should also be considered semi‐quantitative. For all of these reasons, the ANOVA and t tests were performed using nonparametric methods (Wonnacott & Wonnacott, 1985) free of all assumptions regarding the distributions of the parameter values. With the nonparametric methods, the relative ranks of the concentrations and specific conductances were used rather than the actual values.
When using ANOVA to compare multiple populations at once, if differences among populations were found, the Tukey method was applied to examine all pairwise comparisons (e.g., Hsu, 1966). The Tukey method is a conservative approach adjusting the p values to account for simultaneous multiple comparisons. The convention of Freedman et al. (1998) was applied, where p ≤ 0.05 was considered to provide moderate evidence against the null hypothesis, and p ≤ 0.01 was considered providing strong evidence against the null hypothesis (after the Tukey adjustment). In all cases, when comparing ranks of the same parameter, equal variances among populations was assumed.
As mentioned, some sources were sampled and analyzed in more than 1 yr. Those samples were all included in these statistical analyses, violating the assumption of independence of the samples. However, when this occurred the samples were separated by between 6 months and 6 yr. We therefore considered them independent samples.
Comparisons were made between Kanyama and the other communities based on differences in the underlying geology and the expected groundwater vulnerability. These comparisons were performed separately for the different source types because the type of water source was such an important factor and the communities had different relative representations of sources sampled. Private boreholes were not sampled in Kanyama so they were not included. For these comparisons, Kanyama was compared to the other five communities combined.
Pearson correlation tests were used to assess the relationships between the ranks of E. coli, nitrates and specific conductances across all drinking water sources.
4. Water Quality Results and Comparisons Among Water Source Types
4.1. Field‐Measured Water Quality Parameters
Temperature, dissolved oxygen, specific conductance and pH were recorded at most sampling sites during the four sampling efforts. Water temperatures for kiosks, municipal boreholes, private boreholes, and shallow wells averaged 23.7°C, 24.2°C, 22.2°C, and 23.1°C, respectively (92% of all samples were between 20°C and 26°C) (Specific conductance data can be found in the supporting information Date Set S1).
Dissolved oxygen (DO) concentrations ranged from 1.01 to 9.75 mg/L. In general, the concentrations were lower in shallow wells (mean = 4.02 mg/L) and private boreholes (mean = 3.64 mg/L) compared to kiosks (mean = 5.88 mg/L) and municipal boreholes (mean = 5.04 mg/L). The only difference among the source types that was significant at a Tukey‐adjusted p < 0.05 was between water from the kiosks (mean of 5.88 mg/L) and water from shallow wells (mean of 4.02 mg/L) with an adjusted p = 0.028. Higher DO in kiosk water is expected due to aeration during pumping and distribution.
The Zambian drinking water quality standard for pH is 6.5 to 8 (ZABS, 2010). A low pH can indicate the presence of other contaminants including toxic metals (Cirino, 2018), can have a bitter metallic taste and be corrosive (US EPA, 2020). The pH of water from kiosks, municipal boreholes, private boreholes and shallow wells averaged 7.3, 7.5, 7.2, and 7.1, respectively. The pH from water from shallow wells was significantly lower than the water from municipal boreholes (Tukey‐adjusted p = 0.0067). Of the 92 pH measurements made, 82 fell with the acceptable range. Water from one kiosk, one private borehole and three shallow wells fell below a pH of 6.5; water from two municipal boreholes, one private borehole and two shallow wells fell above a pH of 8.0.
The specific conductances in the peri‐urban communities were highly variable, ranging from 383 to 3,180 μS/cm, and averaged 1,200 μS/cm across all sites (Reaver et al., 2020). It exceeded the 1,500 μS/cm standard in 28 of 111 samples; 23 of those exceedances occurred in water from shallow wells. Based on nonparametric analyses, on average, shallow wells had significantly higher specific conductance than kiosks (Tukey‐adjusted p = 3.2 × 10⁻⁴) and municipal boreholes (Tukey‐adjusted p = 2.9 × 10⁻⁴) (Figure 8). Other differences among sources were not significantly different.
Figure 8.
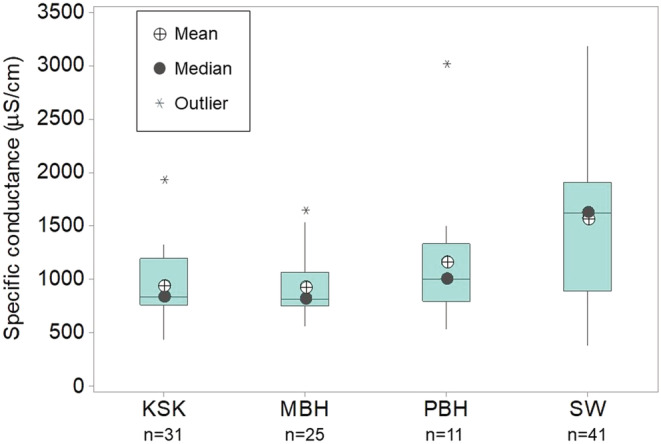
Box‐(middle 50% of the data, i.e., Q3–Q1) and‐whisker (range of values excluding outliers) plot of field‐measured specific conductance in water from kiosks (KSK), municipal boreholes (MBH), private boreholes (PBH), and surface water (SW) in Lusaka area, Zambia.
4.2. Nitrate Contamination
Nitrate analyses were performed for 111 water samples over the four sampling periods (Table 3) (Figure 9). NO3‐N concentrations ranged as high as 110 mg/L. Forty‐eight of the water samples had nitrate‐N concentrations greater than the Zambian drinking water standard of 10 mg/L (ZABS, 2010). Of these 48 samples, 37 were from shallow wells or private boreholes. The relative distributions of NO3‐N concentrations for the four types of water sources can be compared in Figure 9 (Nitrate data can be found in the supporting information Date Set S2). Shallow wells and private boreholes (representing untreated, private water supplies) had significantly higher NO3‐N concentrations (mean of 30 mg/L, mean rank of 70) than the Water Trust water from municipal boreholes and kiosks (mean of 8.8 mg/L, mean rank of 46) with a nonparametric t test p = 1.1 × 10⁻⁴). Individual nonparametric t tests indicated that concentrations at shallow wells were significantly higher than those at municipal boreholes and kiosks (Tukey‐adjusted p = 8.7 × 10⁻³ and 3.4 × 10⁻³, respectively).
Table 3.
Nitrate‐N Concentrations (in mg/L) From All Four Sampling Rounds Sorted by Water Source Type
| All sites | Kiosks | Municipal boreholes | Private boreholes | Shallow wells | |
|---|---|---|---|---|---|
| Mean | 189 | 9.2 | 8.2 | 36 | 28 |
| Median | 5.6 | 4.8 | 4.4 | 25 | 19 |
| Standard Error | 2.4 | 2.8 | 2.4 | 13 | 4.2 |
| Minimum | 0 | 0 | 0 | 0 | 0 |
| Maximum | 110 | 100 | 37 | 110 | 100 |
| Count | 111 | 37 | 20 | 10 | 43 |
Figure 9.
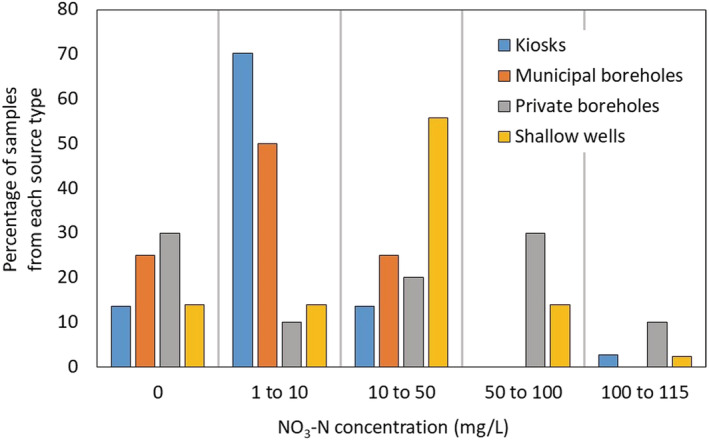
Percentages of samples in varying categories of nitrate‐N concentrations (mg/L) from all samples from all four sampling periods in Lusaka, Zambia.
4.3. Bacterial Contamination
During the four sampling rounds in Lusaka's peri‐urban communities, a total of 109 water samples were analyzed for E. coli bacteria (Figure 10) (Bacterial data can be found in the supporting information Date Set S3). Twenty‐one samples were taken from 14 different municipal boreholes after chlorine treatment. Of all the samples, 18 had no detectable E. coli. Of the three samples with E. coli, concentrations were 3 CFU/100 ml or fewer. Six boreholes were sampled before chlorination (not used in statistical comparisons) and four of these had no detectable E. coli, and one borehole had 1 CFU/100 ml. One of the boreholes in Chaisa had a sample with 13 CFU/100 ml in 2013; however, pre‐chlorination water was sampled from that same borehole in 2014, 2016, and 2019 and no E. coli were detected.
Figure 10.
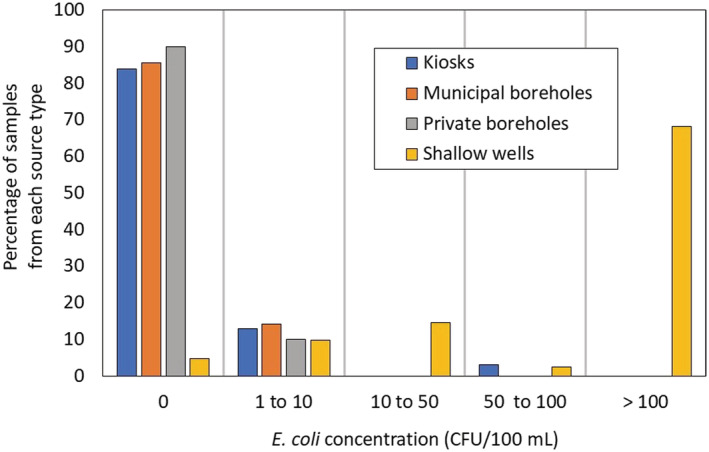
Percentages of samples from each source type in varying categories of E. coli concentrations (CFU/100 ml) from the four sampling periods, Lusaka area, Zambia.
Thirty‐one water samples were taken from kiosks representing municipal borehole water that has been chlorinated and distributed through the Water Trust infrastructure. Twenty‐six of the 31 samples had no detectable E. coli (including one kiosk where 2 samples were taken, one with 0 and one with 1 CFU/100 ml). Four samples had between 1 and 10 CFU/100 ml and water from one kiosk in Ngombe in 2019 had 66 CFU/100 ml.
Private boreholes were also relatively free of E. coli. Only one of 10 samples (taken in Chipata in 2016) had detectable E. coli at a concentration of 1 CFU/100 ml.
Shallow wells were the most contaminated with E. coli by far (Figure 10). Of the 41 shallow wells sampled, only 2 had no detectable E. coli. Water from the majority of the other 39 shallow wells had concentrations >100 CFU/100 ml, and most often the E. coli colonies were TNTC.
Nonparametric t tests revealed strong differences among the sources of water. Water from shallow wells was significantly more contaminated with E. coli than water from kiosks, municipal boreholes and private boreholes, all with Tukey‐adjusted p values of 9.9 × 10⁻⁶. All other differences among the source types were not significant with p values >0.9.
5. Water Quality Comparisons Between Kanyama and the Other Communities
We might expect that Kanyama would have the most severe groundwater contamination due to its location directly on the crystalline dolomite and dolomitic limestone of the Lusaka formation (Figure 1) classified by Kang'omba and Bäumle (2013) as “Extreme” vulnerability (Figure 3, Table 1). The other communities lie either on the Cheta or Chunga formations and were classified as “Moderate” vulnerability (Figures 1 and 3).
Water from shallow wells, kiosks and municipal boreholes all had higher specific conductances on average in Kanyama than in the other communities. Using nonparameteric tests, there was strong and moderate evidence that specific conductance was higher in Kanyama for shallow wells and kiosks with respective p values of 9.1 × 10⁻⁴ and 0.017. There was no evidence for municipal boreholes, probably due to a lower sample size.
There was also strong to moderate evidence that nitrate concentrations in all Kanyama sources were higher than in the other communities. In kiosks, nitrate‐N concentrations in Kanyama averaged 14 mg/L compared to 7.5 mg/L in all other communities; in municipal boreholes, nitrate‐N concentrations in Kanyama averaged 25 mg/L compared to 4.0 mg/L in all other communities; and in shallow wells, nitrate‐N concentrations in Kanyama averaged 56 mg/L compared to 23 mg/L in all other communities. Nonparameteric t tests indicated that the differences for kiosks, municipal boreholes and shallow wells were significant at p values of 0.017, 0.0017, and 0.0026, respectively.
E. coli concentrations in Kanyama water sources were also compared to all other communities using nonparametric t tests, but there were no significant differences among the populations.
6. Correlations Between Water Quality Parameters
Both E. coli and nitrates are commonly associated with human and animal waste and both contaminants likely come from groundwater connections between wells or boreholes and pit latrines. We tested whether bacteria and nitrate concentrations were correlated using a nonparametric Pearson correlation analysis using the relative ranks of both parameters for all water sources and all years (n = 97). E. coli and nitrate‐N ranks were weakly correlated with a correlation coefficient of 0.35; however, this weak correlation was significant at a p = 4.9 × 10⁻⁴. There was a similar correlation between E. coli and specific conductance ranks with a correlation coefficient of 0.48 and p value of 6.8 × 10⁻⁷. NO3‐N and specific conductance ranks were correlated with a correlation coefficient of 0.69 and a p value of 5.0 × 10⁻¹⁵. This strong correlation (shown with NO3‐N concentrations and specific conductance values in Figure 11) indicates that specific conductance could be used as an inexpensive screening tool by water managers to indicate when more in‐depth sampling and analyses for nitrate and E. coli are needed. Although one would not want to use the specific conductance to predict the nitrate concentration, it is interesting to note that every sample with a specific conductance >1,780 μS/cm had a NO3‐N concentration greater than the 10 mg/L standard.
Figure 11.
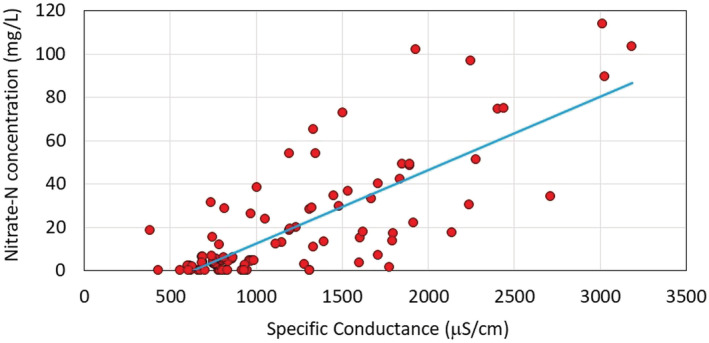
Correlation between the measured NO3‐N concentration and specific conductances with best‐fit trend line.
7. Water Trust Managers Survey Results
The results of this section represent estimates given to us by the Water Trust managers. They were not further verified. The managers provided estimates of their communities' populations, and how many people were actually served with Water Trust water (Table 4). Most residents acquired Water Trust water by bringing containers to the kiosks and paying a Water Trust employee 0.4 kwacha for 20 L ($0.04 in 2016). Many people did not purchase water at kiosks because they had access to private boreholes or water piped directly to their houses. Some choosing not to purchase Water Trust water acquired their water from shallow wells, thus presenting a greater risk of waterborne disease. In Chaisa, Chipata, and Garden, >90% of the population was estimated to be served by their local Water Trust either at kiosks or by water piped directly to their homes. In Chazanga, Kanyama, and Ngombe, most of the population was not served (60%, 67% and 86% not served, respectively). On average the six Water Trusts served only 46% of the total population leaving more than 350,000 residents without access to clean water.
Table 4.
Water Trust Manager Estimates of Water Provision at Kiosks in Lusaka Area, Zambia
| Community | Population | # boreholes | Population served by kiosks | # kiosks | Users per kiosk | Avg. water use (L/d/p) | Population % NOT receiving Water Trust water a |
|---|---|---|---|---|---|---|---|
| Chaisa | 42,000 | 2 | 37,360 | 42 | 890 | 8 | 5 |
| Chipata | 88,000 | 5 | 72,824 | 65 | 1,120 | 8.3 | 9 |
| Chazanga | 112,000 | 3 | 39,400 | 48 | 820 | 23 | 60 |
| Garden | 35,000 | 3 | 30,000 | 37 | 810 | 24 | 3 |
| Kanyama | 300,000 | 4 | 80,000 | 162 | 490 | 4 | 67 |
| Ngombe | 110,000 | 2 | 11,000 | 67 | 164 | 25 | 86 |
Some residents receive Water Trust water piped directly to their homes.
We asked the Water Trust managers to estimate how many people were using shallow well water for some or all of their drinking water supply. This was a very sensitive question in that people generally know that the shallow well water is potentially contaminated. Officials from the Zambia Environmental Management Agency have told us that people might deny using shallow well water for drinking because they do not want government officials burying the shallow wells. The number of people estimated to be using shallow well water for drinking varied widely among the Water Trust managers. In Kanyama, Chipata and Garden, the managers informed us that there were no people doing so. The estimate in Chazanga was about 100, while in Chaisa and Ngombe, the number was about 2,000 and 4,000, respectively.
When asked why their residents might use shallow well water for drinking rather than kiosk water, the Manager in Chazanga thought it was due to people not wanting to walk as far as the nearest kiosk. The Manager in Chaisa thought that about 60% of the people choosing shallow well water did so to avoid the payment at the kiosks while the rest of people were split between the kiosks being too far to walk, kiosk water not tasting as good, inconvenient times that the kiosks were open or long lines at the kiosks. The responses for Ngombe were similar to those for Chaisa.
Water Trust managers were also asked what concerns they had. They worried about lack of training for their staff and adequate water testing equipment including a way to measure residual chlorine in their water supplies. They also worried about insufficient infrastructure, and they wished for more boreholes, storage tanks and kiosks.
8. Implications and Conclusions
Groundwater quality has diminished in the Lusaka Aquifer as a direct result of increasing human activity atop vulnerable karst geology (De Waele & Follesa, 2003; Museteka & Bäumle, 2009; Nkhuwa, 1996; Nyambe, 2000). Consumption of untreated water from shallow wells and private boreholes remains a public health challenge in Lusaka's peri‐urban communities and throughout much of sub‐Saharan Africa. Our E. coli and nitrate data make it clear that shallow wells are substantially more affected by pit latrines than any other water source, including private boreholes. The water provided by the Water Trusts, in contrast, is much cleaner. The Water Trusts have been very successful in providing much improved water to the majority of residents in three of the six peri‐urban communities that we investigated. Water Trusts provide a cleaner and safer alternative to hand‐dug shallow wells. Relatively deep boreholes and chlorine treatment remove the vast majority of microbial contamination. However, about 84% of the water samples from kiosks had no detectable E. coli contamination, leaving 16% with contamination despite the water treatment. Also, 14% of the samples taken directly from the boreholes after chlorination had some detectable E. coli. It should be noted only three kiosk samples and one chlorinated municipal borehole samples had E. coli concentrations >1 CFU/100 ml. There was no evidence that the treated water became more contaminated as it passed through the distribution system.
The nitrate contamination of water across all types of water sources was evident. Shallow wells were consistently contaminated with nitrate with 72% of the water samples exceeding the 10 mg/L NO3‐N standard. The 10 mg/L standard was also exceeded in 60%, 25%, and 16% of the water samples from private boreholes, municipal boreholes and kiosks, respectively. Sixteen percent of the water samples from the Water Trust kiosks. The strong correlation between nitrate concentrations and specific conductance suggests that specific conductance could be used as an inexpensive screening tool for more in‐depth nitrate and E. coli sampling and analyses.
The contrast between the distributions of E. coli and nitrate contamination is especially enlightening. We assume that the cause of both the E. coli and the nitrate contamination is inadequate disposal of human waste, primarily contamination from pit latrines. For both contaminants, the shallow wells were substantially more contaminated than the Water Trust water; however, in the case of E. coli, private boreholes were no more contaminated than the Water Trust water. For nitrates, on the other hand, the level of contamination for private boreholes fell between shallow wells and Water Trust water and was statistically no different from either with p values all greater than 0.33. This difference is probably a result of the greater mobility of nitrate in groundwater systems compared to bacteria (e.g., Fetter et al., 2017; Kadyampakeni et al., 2018; Levy et al., 2007). The low E. coli occurrences in Water Trust water and private boreholes does not mean that those water sources are not hydraulically connected to the pit latrines. Rather, because of the greater depths and longer pathways associated with the boreholes, it is less likely for E. coli to be present. Nitrate, on the other hand, as a fairly conservative tracer, is able to travel through the groundwater system even to depths of 50 m or more (e.g., Fetter et al., 2017), which may explain why five of the water samples from the Water Trust boreholes had NO3‐N levels exceeding the safe drinking water standard of 10 mg/L. While the depths of the private boreholes are unknown, our assumption is that they are generally not as deep as the Water Trust boreholes. This would account for the fact that 60% and 40% of the private borehole samples exceeded nitrate‐N concentrations of 10 and 50 mg/L, respectively.
Groundwater contamination vulnerability maps, like the one provided by Kang'omba and Bäumle (2013), are useful water management tools. The data from this study supported the classification of “Extreme Vulnerability” for Kanyama compared to “Moderate” for the other communities. However, our investigation also suggested that even a moderate vulnerability designation is cause for concern in these peri‐urban communities.
Our water quality and survey data support the need for expansion of the Water Trusts' distribution facilities, adding chlorine treatment to water from private boreholes and discouraging the use of shallow wells. This can be achieved by subsidizing the cost of water from the Water Trust public taps to increase access to the water, particularly for households managed by the elderly, single mothers, the disabled, and the orphaned. We implore the local authorities and the Ministry of Health to work together with environmental and water agencies to continue monitoring and burying the shallow wells assuming residents can be provided an alternative source of affordable, clean water.
The Water Trusts bridge the water service gap in the peri‐urban areas while helping to promote community involvement and gender equity. We estimate that the Water Trusts serve at least 60% of the 700,000 residents of these six communities, and that is commendable. However, Water Trusts, as currently funded, are unable to keep up with demand in ever growing peri‐urban settings, one factor that leads to a lack of access to clean drinking water. Water Trust managers require more resources to build more kiosks, provide piped water to more households, and perhaps construct safer latrines that are not directly connected to the karst conduits. In addition, resources are required to monitor and improve the Water Trust water quality, including regularly testing for E. coli and residual chlorine. The Water Trust model has been successful; however, in addition to the challenges of the day‐to‐day delivery of safe and clean water, the peri‐urban communities also face the broader social and economic challenges that keep 40% of the populations from using the safer Water Trust water.
Conflict of Interest
The authors declare no conflicts of interest relevant to this study.
Supporting information
Supporting Information S1
Data Set S1
Data Set S2
Data Set S3
Data Set S4
Acknowledgments
This work was partially funded by the Fulbright Specialist Program, U.S. Department of State, and by the Global Health Research Innovation Center of Miami University. We are grateful to our many colleagues at the University of Zambia, including all the Integrated Water Resources Management staff and students. We also thank all of the Miami University students who participated in the summer and winter workshops during which most of these data were collected. Thanks also go to Nathan Reaver for his assistance with statistical work. We are grateful for nitrate analyses at Miami University by John Morton, Department of Geology and Environmental Earth Science, and Tera Ratliff, Institute for the Environment and Sustainability. We would most like to thank the Water Trust Managers and staff who welcomed us to their communities and helped with the surveys including Barney Chinkuli, Wilson Kambeu, Mr. Kasenge, Laban Kateya, Bernard Linynnge, Kennedy Lungu, Isaac Mbewe, Emmanuel Mwanza, Arnold Simbeye, Sylvester Sismasiye, and Henry Zima.
Reaver, K. M. , Levy, J. , Nyambe, I. , Hay, M. C. , Mutiti, S. , Chandipo, R. , et al. (2021). Drinking water quality and provision in six low‐income, peri‐urban communities of Lusaka, Zambia. GeoHealth, 5, e2020GH000283 10.1029/2020GH000283
Data Availability Statement
The data that support the findings of this study are openly available in Zenodo at http://doi.org/10.5281/zenodo.4292400, reference number 4292400.
References
- Adelana, S. M. A. , Abiye, T. A. , Nkhuwa, D. C. W. , Tindimugaya, C. , & Oga, M. S. (2008). Urban groundwater management and protection in Sub‐Saharan Africa (pp. 231–260). London: Applied Groundwater Studies in Africa. Taylor & Francis. [Google Scholar]
- Adelana, S. M. A. , & MacDonald, A. M. (2008). Groundwater research issues in Africa In Adelana S. M. A. & MacDonald A. M. (Eds.), Applied groundwater studies in Africa (p. 108). London, UK: British Geological Society, Taylor and Francis Group. [Google Scholar]
- Bäumle, R. , & Kang'omba, S. (2009). Development of a groundwater information and management program for the Lusaka Groundwater Systems: Report No. 2, desk study and proposed work program report. Federal Ministry for Economic Cooperation and Development (BMZ), Project number BMZ PN2003 2024.2 (Phase I), BGR 05‐2315‐01, 101 p.
- Bäumle, R. , & Kang'omba, S. (2012). Hydrogeological map of Zambia, Lusaka Province, first edition. Department of Water Affairs, Ministry of Lands, Energy and Water Development, Lusaka, Zambia & Federal Institute for Geosciences and Natural Resources, BGR, Hannover; Germany
- Chande, M. M. , & Mayo, A. W. (2019). Assessment of groundwater vulnerability and water quality of Ngwerere sub‐catchment urban aquifers in Lusaka, Zambia. Physics and Chemistry of the Earth, Parts A/B/C, 112, 113–124. 10.1016/j.pce.2019.03.004 [DOI] [Google Scholar]
- Cirino, E. (2018). What pH should my drinking water be? Healthline https://www.healthline.com/health/ph‐of‐drinking‐water. Accessed 5/25/2020.
- CSO (2012). 2010 Census of population and housing. National Analytic Report . Central Statistics Office, Lusaka, Zambia. Retrieved from https://www.zamstats.gov.zm/phocadownload/2010_Census/2010 Census of Population National Analytical Report.pdf
- De Waele, J. , Nyambe, I. A. , Di Gregorio, A. , Di Gregorio, F. , Simasiku, S. , Follesa, R. , & Nkemba, S. (2004). Urban waste landfill planning and karstic groundwater resources in developing countries: The example of Lusaka (Zambia). Journal of African Earth Sciences, 39(3–5), 501–508. 10.1016/j.jafrearsci.2004.07.014 [DOI] [Google Scholar]
- De Waele, J. D. E. , & Follesa, R. (2003). Human impact on karst: The example of Lusaka (Zambia). International Journal of Speleology, 32(1/4), 71–83. 10.5038/1827-806X.32.1.5 [DOI] [Google Scholar]
- Fan, A. M. , Willhite, C. C. , & Book, S. A. (1987). Evaluation of the nitrate drinking water standard with reference to infant methemoglobinemia and potential reproductive toxicity. Regulatory Toxicology and Pharmacology, 7(2), 135–148. 10.1016/0273-2300(87)90024-9 [DOI] [PubMed] [Google Scholar]
- Fetter, C. W. , Boving, T. , & Kreamer, D. (2017). Mass transport in saturated media In Contaminant Hydrogeology (3rd ed., pp. 56–133). Long Grove, IL: Waveland Press, Inc. [Google Scholar]
- Franceys, R. , & Gerlach, E. (2005). Regulating public and private partnerships for the poor. Centre for Water Science, Cranfield University. Cranfield, Bedfordshire, MK43 0AL, UK, 190 p.
- Freedman, D. , Pisani, R. , & Purves, R. (1998). Statistics (3rd ed., p. 578). New York: WW Norton Publishing. [Google Scholar]
- Hsu (1966). Multiple comparisons: Theories and methods (p. 296). Boca Raton: Chapman & Hall/CRC. [Google Scholar]
- IFRCRCS (2018) Zambia: Cholera outbreak Lusaka. Emergency Plan of Action Final Report, June 25, 2018, International Federation of Red Cross and Red Crescent Societies, 14 p.
- Kadimba‐Mwanamwambwa, C. , Chileshe‐Nkoloma, H. , & Kayaga, S. (2005). Linking community to policy level support: The CARE‐Zambia trust model. In Maximizing the Benefits from Water and Environmental Sanitation: Proceedings of the 31st WEDC Conference (pp. 214–217). Retrieved from http://www.scopus.com/inward/record.url?eid=2‐s2.0‐84891413650&partnerID=tZOtx3y1
- Kadyampakeni, D. M. , Nkedi‐Kizza, P. , Leiva, J. A. , Muwamba, A. , Fletcher, E. , & Morgan, K. T. (2018). Ammonium and nitrate transport during saturated and unsaturated water flow through sandy soils. Journal of Plant Nutrition and Soil Science, 181(2), 198–210. 10.1002/jpln.201700405 [DOI] [Google Scholar]
- Kang'omba, S. & Bäumle, R. (2013). Development of a groundwater information and management program for the Lusaka groundwater systems, final report: Key recommendations and Findings. Republic of Zambia Ministry of Mines, Energy and Water Development and the Federal Republic of Germany Federal Institute for Geosciences and Natural Resources, Lusaka, Zambia, 77 p.
- Karen, M. , Godau, T. , Petulo, P. , Lungomesha, S. (2019). Investigation of groundwater vulnerability and contamination in Lusaka as possible factors in the 2017/18 cholera epidemic. GeoSFF Technical Report No. 1, Federal Ministry for Economic Cooperation and Development, BMZ‐No. 2015.3503.8, 43 p.
- Kayaga, S. , & Kadimba‐Mwanamwambwa, C. (2006). Bridging Zambia's water service gap: NGO/community partnerships. Proceedings of the ICE ‐ Water Management, 159(3), 155–160. 10.1680/wama.159.3.155 [DOI] [Google Scholar]
- Lapworth, D. J. , Nkhuwa, D. C. W. , Okotto‐Okotto, J. , Pedley, S. , Stuart, M. E. , Tijani, M. N. , & Wright, J. (2017). Urban groundwater quality in sub‐Saharan Africa: Current status and implications for water security and public health. Hydrogeology Journal, 25, 1093–1116. 10.1007/s10040-016-1516-6 [DOI] [PMC free article] [PubMed] [Google Scholar]
- Levy, J. , Sun, K ., Findlay, R. H. , Farruggia, F. T. , Porter, J. , Mumy, K. L. , Tomaras, J. & Tomaras, A. (2007). Transport of Escherichia coli bacteria through laboratory columns of glacial outwash sediments: Estimating model parameter values based on sediment characteristics. Journal of Contaminant Hydrology, 89: 71–106, 10.1016/j.jconhyd.2006.08.006 [DOI] [PubMed] [Google Scholar]
- Liddle, E. S. , Mager, S. M. , & Nel, E. L. (2015). The suitability of shallow hand dug wells for safe water provision in sub‐Saharan Africa: Lessons from Ndola, Zambia. Applied Geography, 57, 80–90. 10.1016/j.apgeog.2014.12.010 [DOI] [Google Scholar]
- Maseka, C. , & Nyambe, I. A. (1999). Lusaka's groundwater resources at risk. In: Delvin J (ed) Environmental Capacity Enhancement Project, Canadian International Development Agency, pp. 75‐90.
- Mpamba, N. H. , Hussen, A. , Kangomba, S. , Nkhuwa, D. C. W. , Nyambe, I. A. , Mdala, C. , Wohnlich, S. , & Shibasaki, N. (2008). Evidence and implications of groundwater mining in the Lusaka urban aquifers. Physics and Chemistry of the Earth, 33(8–13), 648–654. 10.1016/j.pce.2008.06.015 [DOI] [Google Scholar]
- Museteka, L. , & Bäumle, R. (2009). Development of a groundwater information & management program for the Lusaka groundwater systems. Federal Ministry for Economic Cooperation and Development (Vol. 1). Retrieved from https://www.bgr.bund.de/EN/Themen/Wasser/Projekte/abgeschlossen/TZ/Zambia/lu_report_1.pdf?__blob=publicationFile&v=4
- Nkhuwa, D. C. W. (1996). Hydrogeological and engineering geological problems of urban development over karstified marble in Lusaka, Zambia (63rd ed.). Rheinisch‐Westfälische Technische Hochschule Aachen.
- Nkhuwa, D. C. W. (2003). Human activities and threats of chronic epidemics in a fragile geologic environment. Physics and Chemistry of the Earth, Parts A/B/C, 28(20–27), 1139–1145. 10.1016/j.pce.2003.08.035 [DOI] [Google Scholar]
- Nyambe, I. A. , & Maseka, C. (2000). Groundwater pollution, landuse and environmental impacts on Lusaka aquifer. In O. Sililo (Ed.), Proceedings of the XXX IAH Congress on Groundwater: Past Achievements and Future Challenges (pp. 803–808). Capetown, Couth Africa: A.A. Balkema, P.O. Box 1675, 3000 BR Rotterdam, Netherlands.
- Reaver, K. , Levy, J. , Nyambe, I. , Hay, M. C. , Mutiti, S. , Chandipo, R. & Meiman, J. (2020). Data sets: An assessment of Water Trusts: Drinking water quality and provision in six low‐income, peri‐urban communities of Lusaka, Zambia [data set]. GeoHealth. Zenodo. 10.5281/zenodo.4292400 [DOI] [PMC free article] [PubMed]
- Sasaki, S. , Suzuki, H. , Fujino, Y. , Kimura, Y. , & Cheelo, M. (2009). Impact of drainage networks on cholera outbreaks in Lusaka, Zambia. American Journal of Public Health, 99(11), 1982–1987. 10.2105/AJPH.2008.151076 [DOI] [PMC free article] [PubMed] [Google Scholar]
- Sasaki, S. , Suzuki, H. , Igarashi, K. , Chapula, B. , & Mulenga, P. (2008). Spatial analysis of risk factor of cholera outbreak for 2003–2004 in a peri‐urban area of Lusaka, Zambia. The American Journal of Tropical Medicine and Hygiene, 79(3), 414–421. 10.4269/ajtmh.2008.79.414 [DOI] [PubMed] [Google Scholar]
- Sinyange, N. , Brunkard, J. M , Kapata, N. , Mazaba, M. L. , Musonda, K. G. , Hamoonga, R. , Kapina, M. , Kapaya, F. , Mutale, L. Kateule, E. , Nanzaluka, F. Zulu, J. , Musyani, C.L. , Winstead, A.V. , Davis, W.W. , N'cho, H.S. , Mulambya, N.L. , Sakubita, P. , Chewe, O. , Nyimbili, S. , Onwuekwe, E.V.C. , Adrien, N. , Blackstock, A.J. , Brown, T.W. , Derado, G. , Garrett, N. , Kim, S. , Hubbard, S. , Kahler, A.M. , Malambo, W. , Mintz, E. , Murphy, J. , Narra, R. , Rao, G.G. , Riggs, M.A. , Weber, N. , Yard, E. , Zyambo, K.D. , Bakyaita, N. , Monze, N. , Malama, K. , Mulwanda, J. , Mukonka, V.M. (2018). Cholera epidemic—Lusaka, Zambia, October 2017–May 2018. MMWR Morb Mortal Wkly Rep 2018;67:556–559. 10.15585/mmwr.mm6719a5externalicon [DOI] [PMC free article] [PubMed]
- Sladoje, M. (2018). Cholera outbreak in Zambia: An institutional perspective. International Growth Centre, Policy Brief, March 2018, Zambia, 9 p.
- Snedecor, G. W. , & Cochran, W. G. (1980). Statistical methods (7th ed. p. 507). Ames, Iowa: Iowa State University Press. [Google Scholar]
- Sorensen, J. P. R. , Lapworth, D. J. , Read, D. S. , Nkhuwa, D. C. W. , Bell, R. A. , Chibesa, M. , Chirwa, M. , Kabika, J. , Liemisa, M. , & Pedley, S. (2015). Tracing enteric pathogen contamination in sub‐Saharan African groundwater. Science of the Total Environment, 538, 888–895. 10.1016/j.scitotenv.2015.08.119 [DOI] [PubMed] [Google Scholar]
- US EPA (2020). Secondary drinking water standards: Guidance for nuisance chemicals, https://www.epa.gov/sdwa/secondary‐drinking‐water‐standards‐guidance‐nuisance‐chemicals, last updated January 27, 2020.
- Von Hoyer, H. , Köhler, G. & Schmidt, G. (1978). Groundwater and management studies for Lusaka water supply, Part 1: Groundwater studies, Vol. I, Text, Vol. III + IV: Annexes, Vol. V: Maps. Federal Institute for Geosciences and Natural Resources (BGR) & Lusaka City Council, Lusaka, Zambia, 152 p.
- Wendt, K. (2000). Determination of nitrate/nitrite in surface and wastewaters by flow injection analysis. Lachat Instruments Method Report, 10‐107‐04‐1‐A
- WHO (1997). Guidelines for drinking‐water quality, second edition, volume 3, surveillance and control of community supplies (p. 16). Geneva: World Health Organization. [Google Scholar]
- Wonnacott, R. J. , & Wonnacott, T. H. (1985). Introductory statistics (4th ed. p. 649). New York: John Wiley and Sons. [Google Scholar]
- ZABS (2010). Zambian standard (first revision): Drinking water quality—Specification. Zambia Bureau of Standards, Lusaka, Zambia, 14 p.
Associated Data
This section collects any data citations, data availability statements, or supplementary materials included in this article.
Supplementary Materials
Supporting Information S1
Data Set S1
Data Set S2
Data Set S3
Data Set S4
Data Availability Statement
The data that support the findings of this study are openly available in Zenodo at http://doi.org/10.5281/zenodo.4292400, reference number 4292400.


