
Figure 1. atg-Gene-Deficient Zebrafish Show Larval Lethality and Defective Inflation of the Swim Bladder.
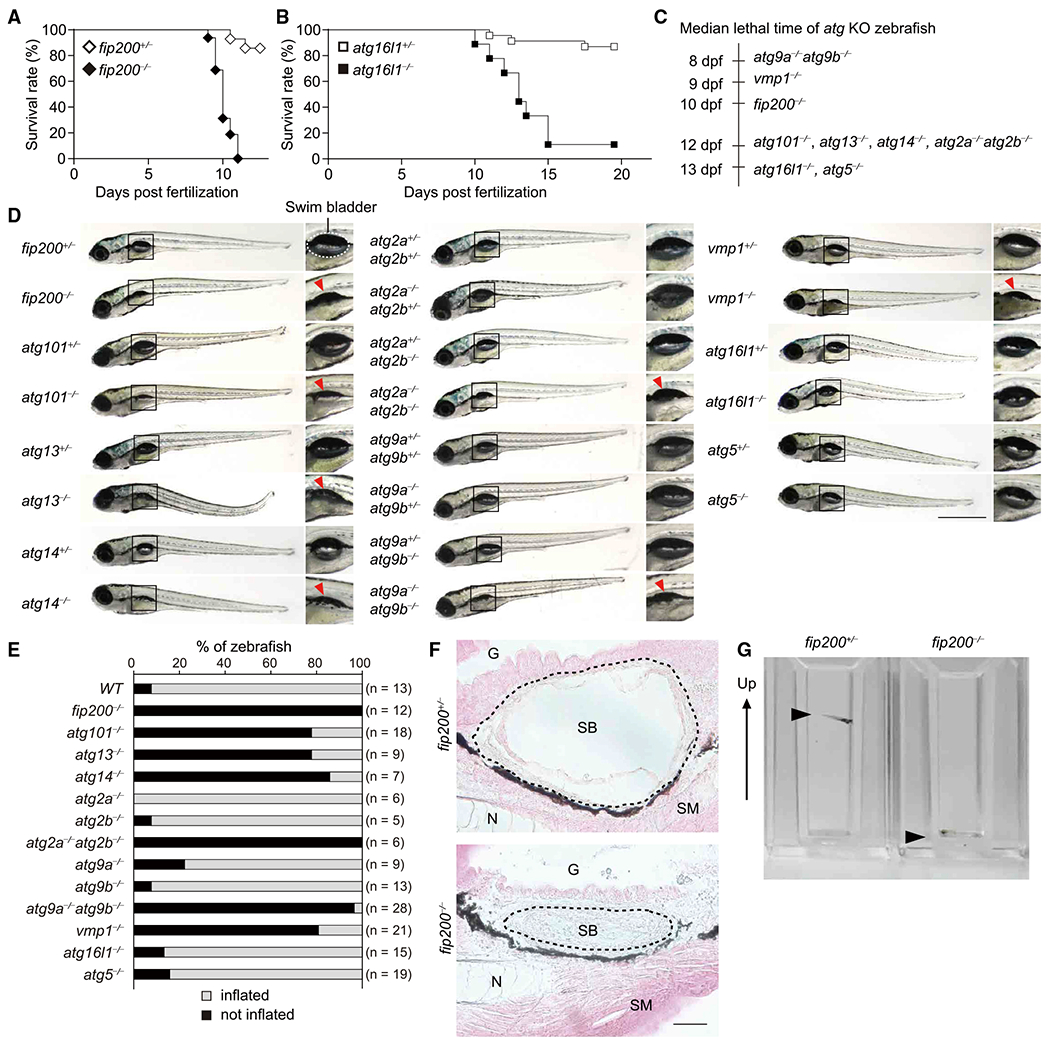
(A and B) Survival rate (%) of fip200+/− (n = 28), fip200−/− (n = 16) (A), atg16l1+/− (n = 23), and atg16l1−/− (n = 9) (B) zebrafish.
(C) Median lethal time of atg9a−/−atg9b−/− (n = 24), vmp1−/− (n = 11), fip200−/− (n = 16), atg101−/− (n = 12), atg13−/− (n = 15), atg14−/− (n = 5), atg2a−/−atg2b−/− (n = 6), atg16l1−/− (n = 9), and atg5−/− (n = 15) zebrafish. dpf, days post-fertilization.
(D) External appearance of atg-deficient zebrafish at 9 dpf(atg9 mutant zebrafish were examined at 6 dpf). Magnified images of the indicated regionsareshown in the right panels. A swim bladder is indicated with a dashed line in fip200+/− zebrafish. Uninflated swim bladders are indicated by red arrowheads. Data are representative of two to four independent experiments. Scale bar, 1 mm.
(E) Rate (%) of inflated (white column) and uninflated (black column) zebrafish swim bladders for each genotype at 9 dpf(atg9 mutant zebrafish were examined at 6 dpf).
(F) Hematoxylin and eosin staining of sagittal sections of 9-dpf fip200+/− and fip200−/− zebrafish. G, gut; N, notochord; SB, swim bladder (indicated by dashed lines); SM, skeletal muscle. Scale bar, 20 μm.
(G) Behavioral analysis of 6-dpf fip200+/− and fip200−/− zebrafish in cuvettes. The arrow indicates the upward direction of the cuvettes. The arrowheads indicate zebrafish. The video from which these stills images were captured is available as Video S1.