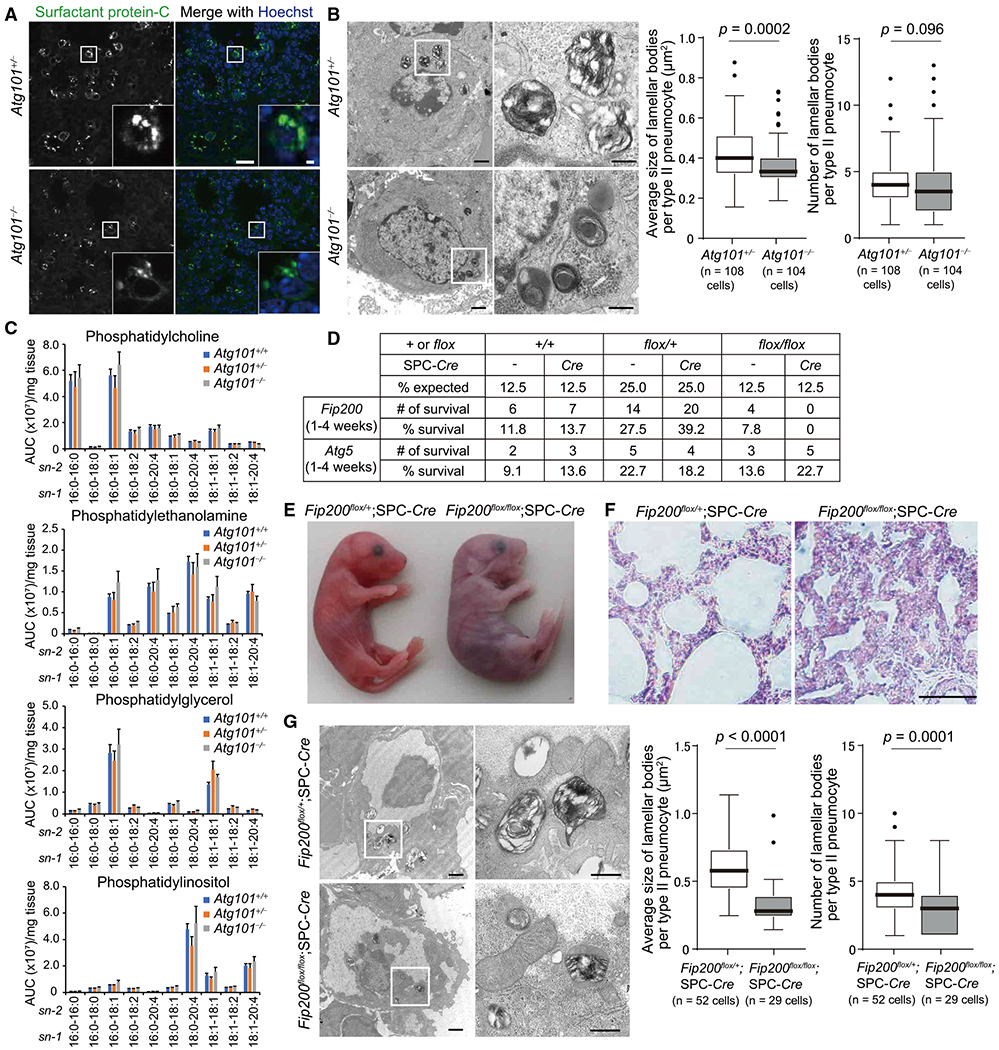
Figure 4. Defective Maturation of Lamellar Bodies in Type II Pneumocytes in Atg101- and Fip200-Deficient Mice.

(A) Immunohistochemistry of the lung from 17.5-dpc Atg101+/− and Atg101−/− mice using anti-SPC antibody. Nuclear DNA was stained with Hoechst33342. Scale bar, 20 μm and 2 μm in the inset.
(B) Transmission electron microscopy of type II pneumocytes from 17.5-dpc Atg101+/− and Atg101−/− mice. Magnified images of the indicated regions are shown in the right panels. The average size (cross-sectional area) of each lamellar body was quantified (108 cells and 104 cells for Atg101+/− and Atg101−/− mice, respectively). The solid bars and boxes indicate the median and interquartile range (25th to 75th percentile), respectively. The whiskers indicate the upper and lower quartiles, and outliers are plotted individually. Differences were statistically analyzed by unpaired two-tailed Mann-Whitney U tests. Scale bar, 1 μm and 400 nm in magnified panels.
(C) LC-MS/MS analysis of the number of indicated phospholipids in the lung from 17.0-dpc Atg101+/+ (n = 4), Atg101+/− (n = 5), and Atg101−/− (n = 4) mice. The y axis indicates relative abundance (area under the curve, AUC [arbitrary units]) per mg tissue (means ± SEM).
(D) Survival rate of offspring from intercrosses of Fip200flox/+ and Fip200flox/+;SPC-Cre mice or Atg5flox/+ and Atg5flox/+;SPC-Cre mice.
(E and F) External appearance (E) and hematoxylin and eosin staining of the lung (F) of neonatal Fip200flox/+;SPC-Cre and Fip200flox/flox;SPC-Cre mice at 1 h after birth. The video from which these stills were captured is available as Video S2.
(G) Transmission electron microscopy of type II pneumocytes in the lung from Fip200flox/+;SPC-Cre and Fip200flox/flox;SPC-Cre mice at 1 h after birth was performed and analyzed as in (B) (52 cells and 29 cells for Fip200flox/+;SPC-Cre and Fip200flox/flox;SPC-Cre mice, respectively). Scale bar, 1 μm and 400 nm in magnified panels.
See also Figures S2–S4 and Video S2.
