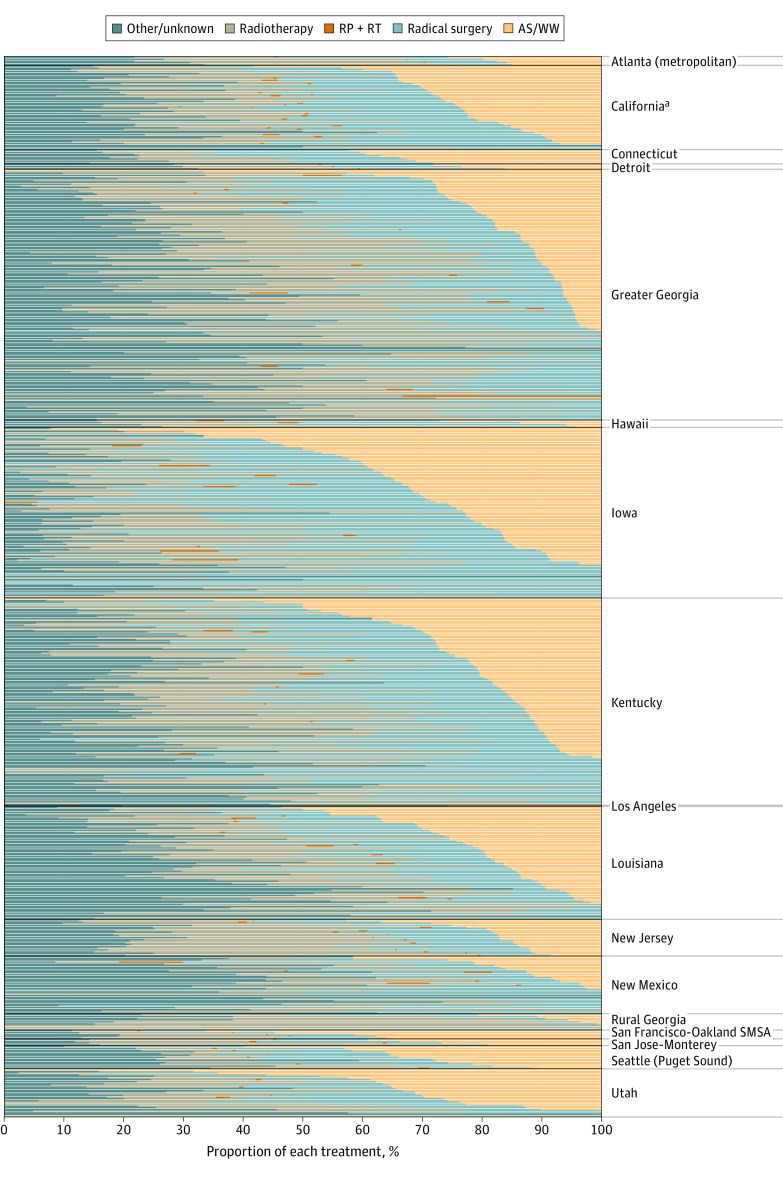
Figure 2. Treatment Trends for Men With Low-Risk Prostate Cancer by County.
The proportion of each treatment in men with clinically localized, low-risk prostate cancer by county within each Surveillance, Epidemiology, and End Results registry from 2010 to 2015.
aExcluding San Francisco/San Jose–Monterey/Los Angeles.

