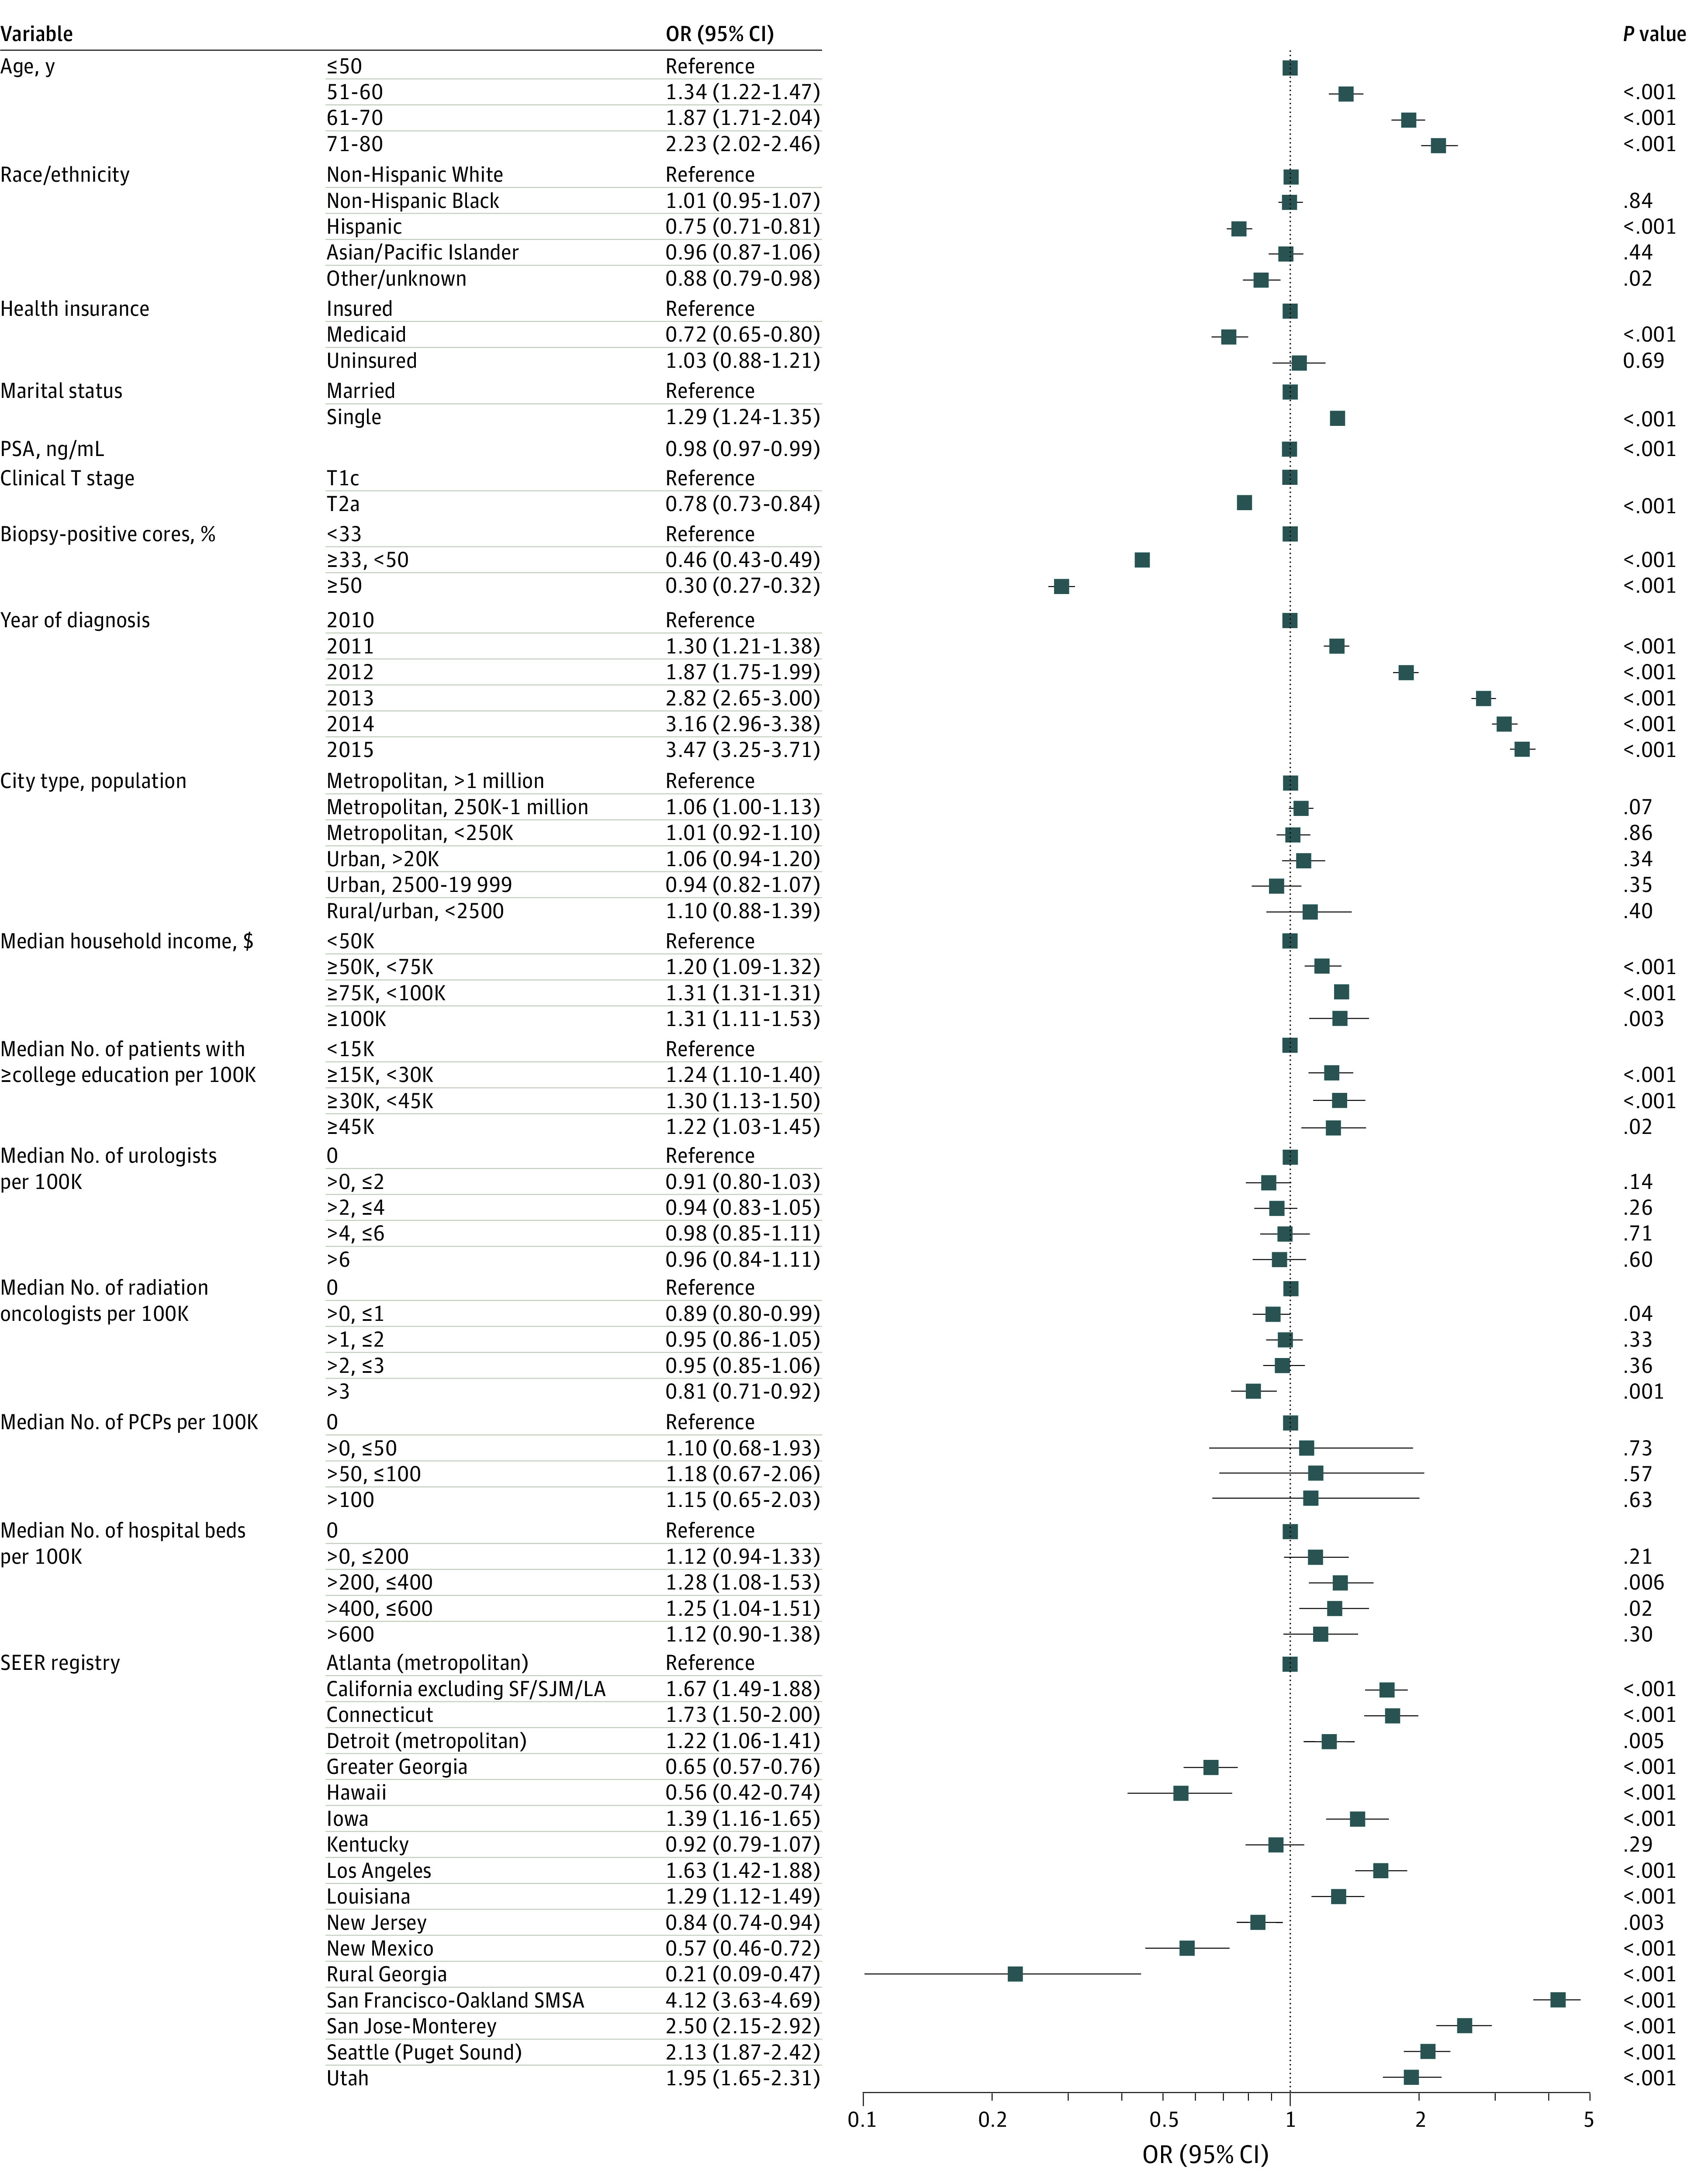
Figure 3. Factors Associated With Active Surveillance Compared With Active Treatment.

Forest plot showing odds ratios (ORs) from the multivariable logistic regression model for factors associated with active surveillance compared to active treatment or other treatments among men with clinically localized, low-risk prostate cancer. Error bars indicate 95% CIs. PCP indicates primary care physician; PSA, prostate-specific antigen; SEER, Surveillance, Epidemiology, and End Results; SF/SJM/LA, San Francisco/San Jose–Monterey/Los Angeles; SMSA, standard metropolitan statistical area.
