
Figure 3.
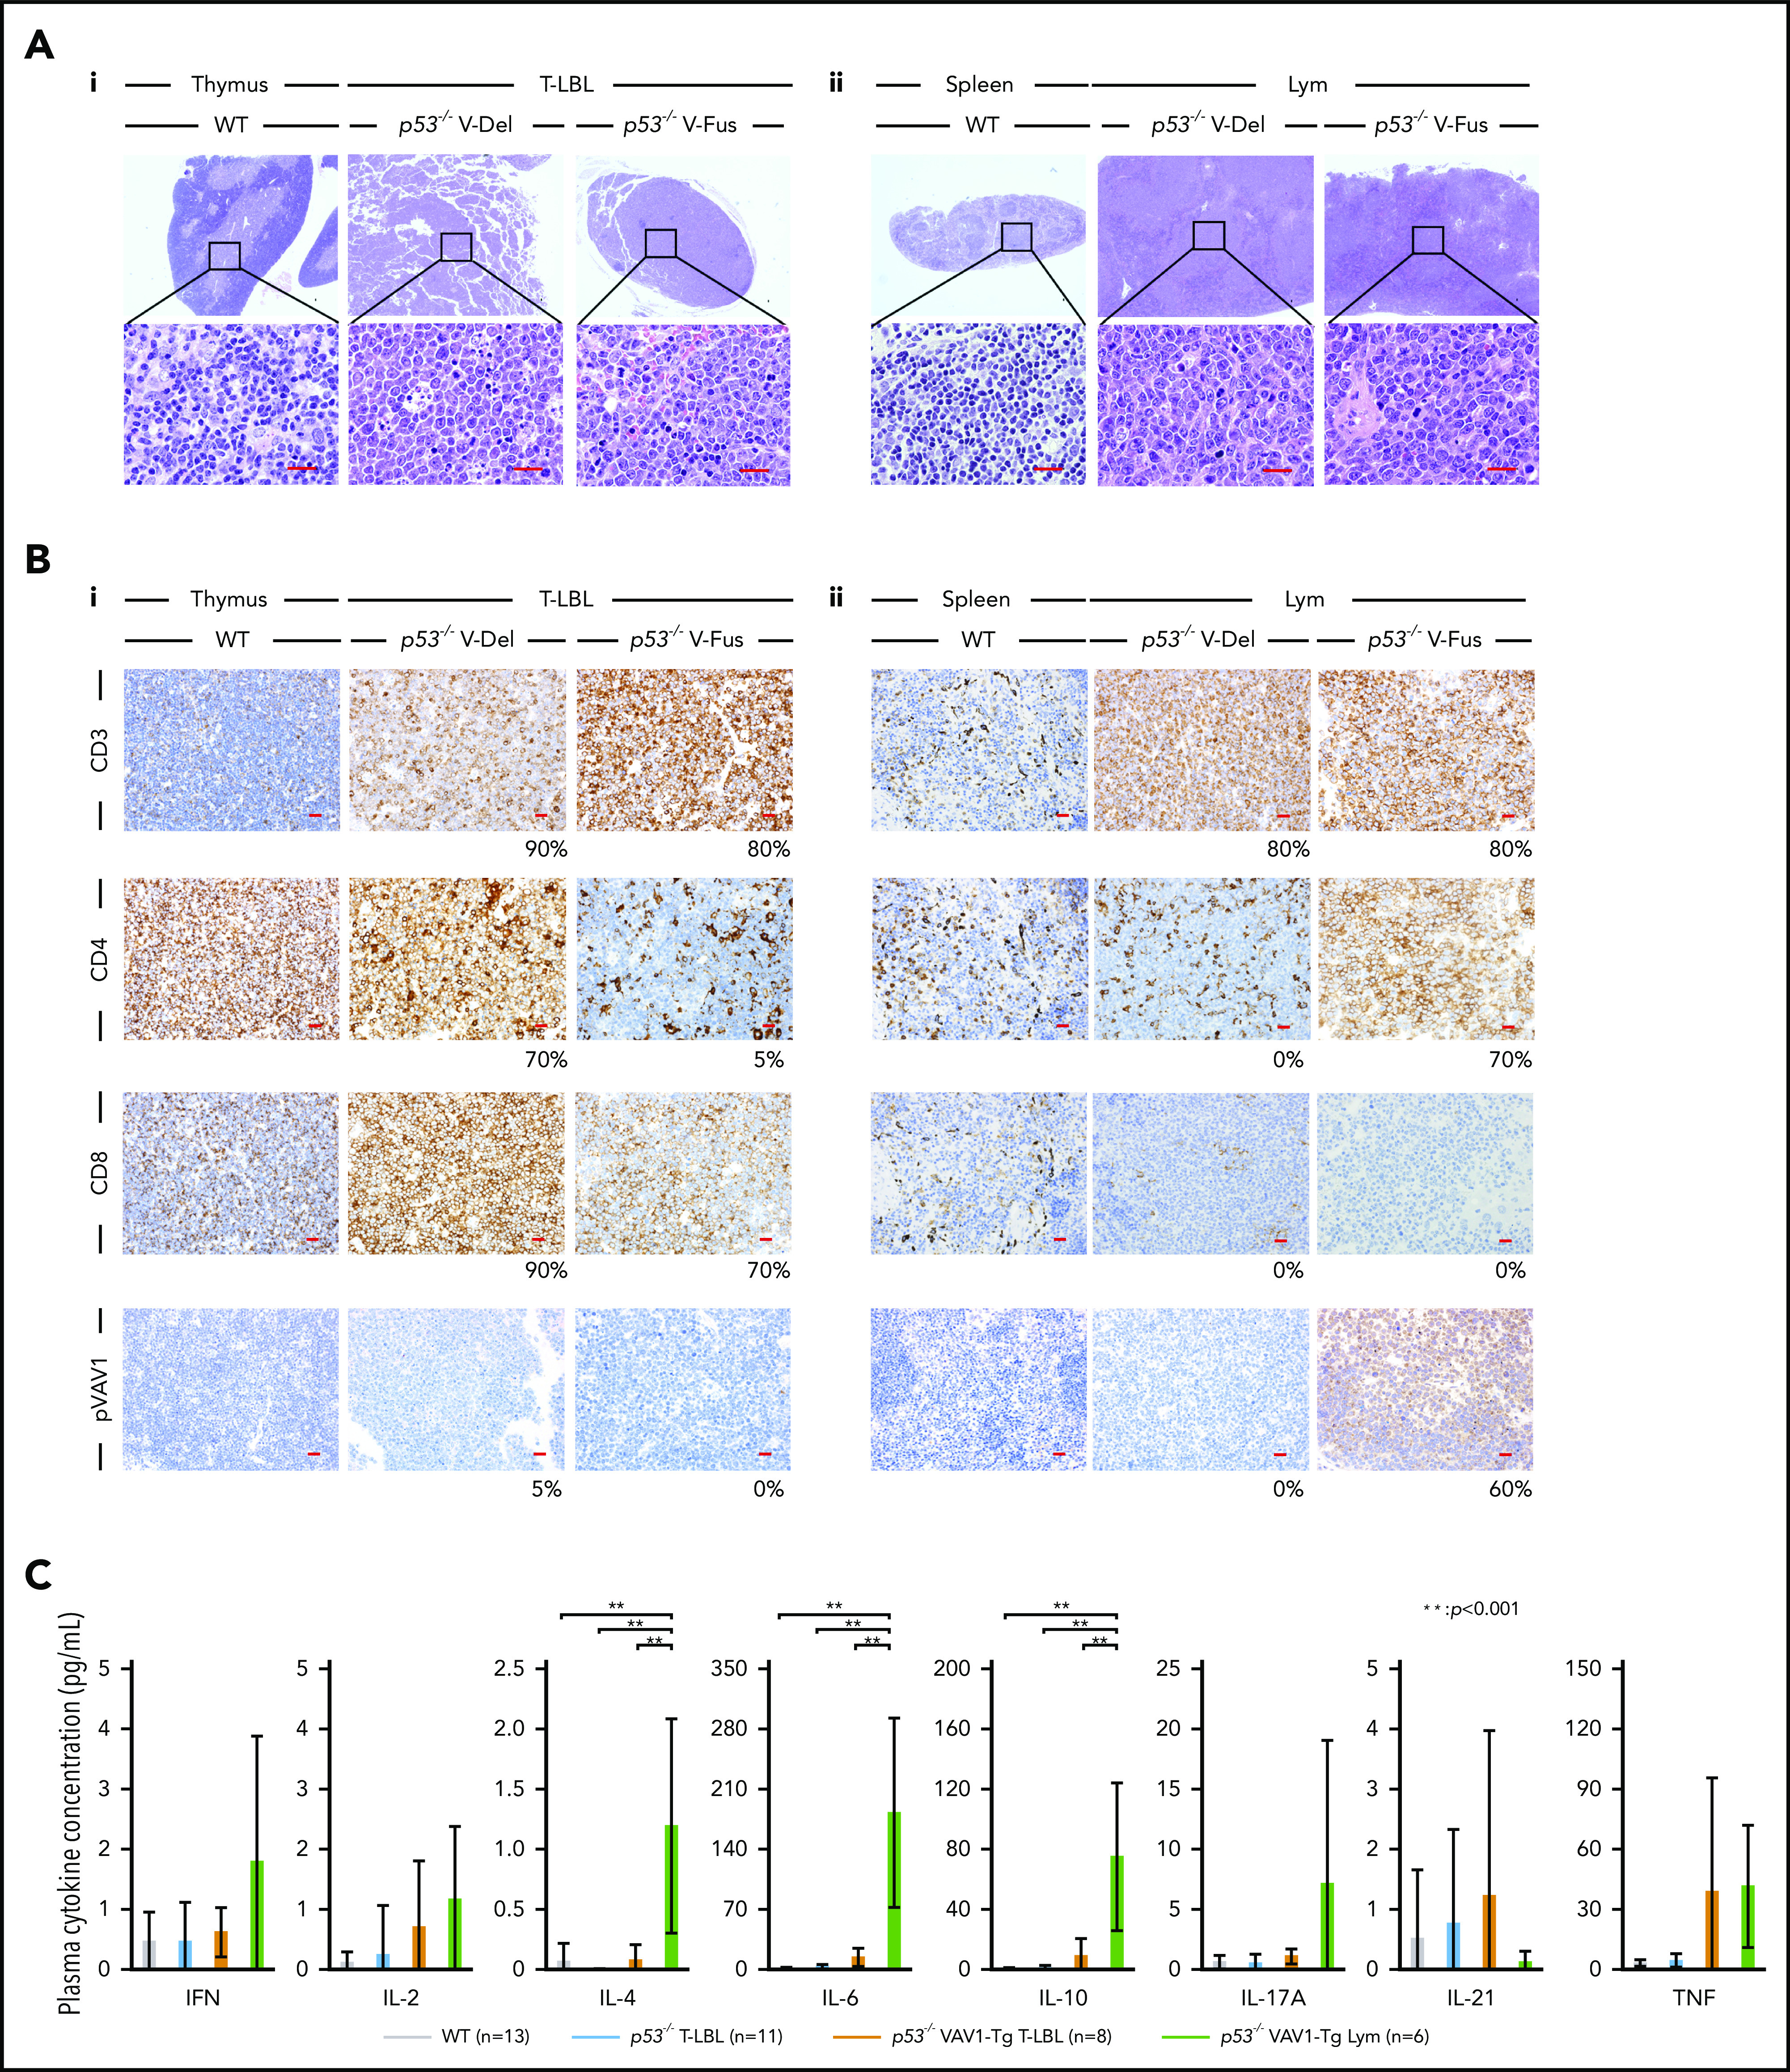
Characterization of tumors found in VAV1-mutant p53-null mice. (A) Sections stained by hematoxylin-eosin (HE) for tumors collected from mice of indicated genotypes. (i) Thymuses from indicated mutant mice harboring T-LBL plus control WT mice. (ii) Spleens from indicated mutant mice harboring Lym plus WT mice. Original magnification: ×4; insets, ×100. Scale bars, 20 µm. (B) Immunohistochemical analysis of CD3, CD4, CD8a, and phosphorylated-VAV1 (pVAV1). (i) Thymuses from indicated mutant mice harboring T-LBL or WT mice. (ii) Spleens from indicated mutant mice harboring Lym or WT mice. Original magnification ×40. Scale bars, 20 µm. The percentages at the bottom right corner of figures for both T-LBL and Lym samples indicate the positivity in the tumor cells. (C) Serum cytokines found in blood of tumor-bearing mice of indicated genotypes measured at 16 to 24 weeks as control WT mice. The number of mice analyzed is as follows: WT, n = 13; p53−/− mice bearing T-LBL, n = 11; p53−/− VAV1-Tg mice bearing T-LBL, n = 8; p53−/− VAV1-Tg mice bearing Lym, n = 6. **P < .001.