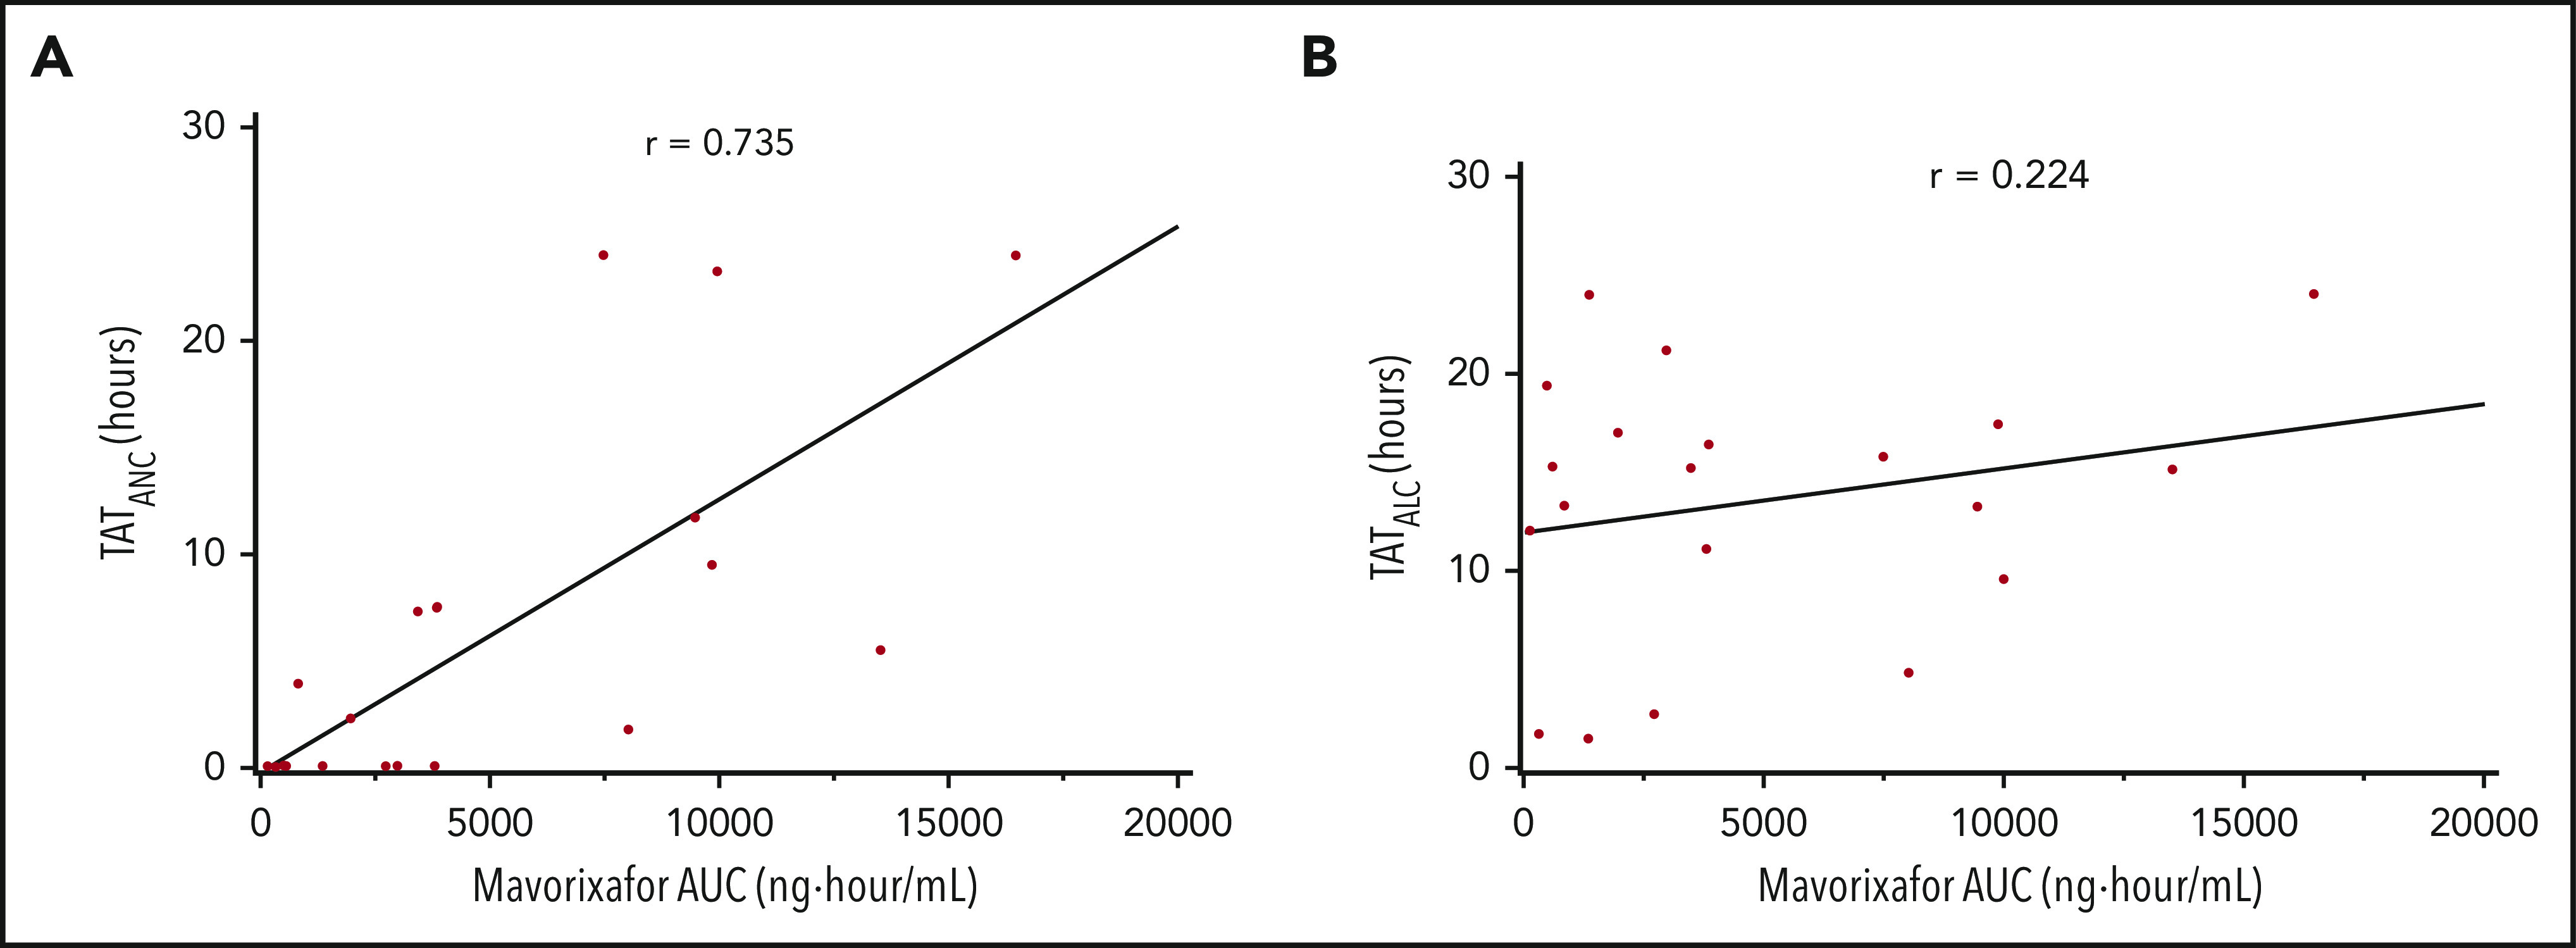
Figure 3.

Correlation between the hematologic response and mavorixafor concentration. The correlation coefficient is represented by r. Subjects may contribute to 1 or more time points because of dose escalation and/or repeated sampling over time. (A) Correlation between TATANC and mavorixafor concentration. (B) Correlation between TATALC and mavorixafor concentration.
