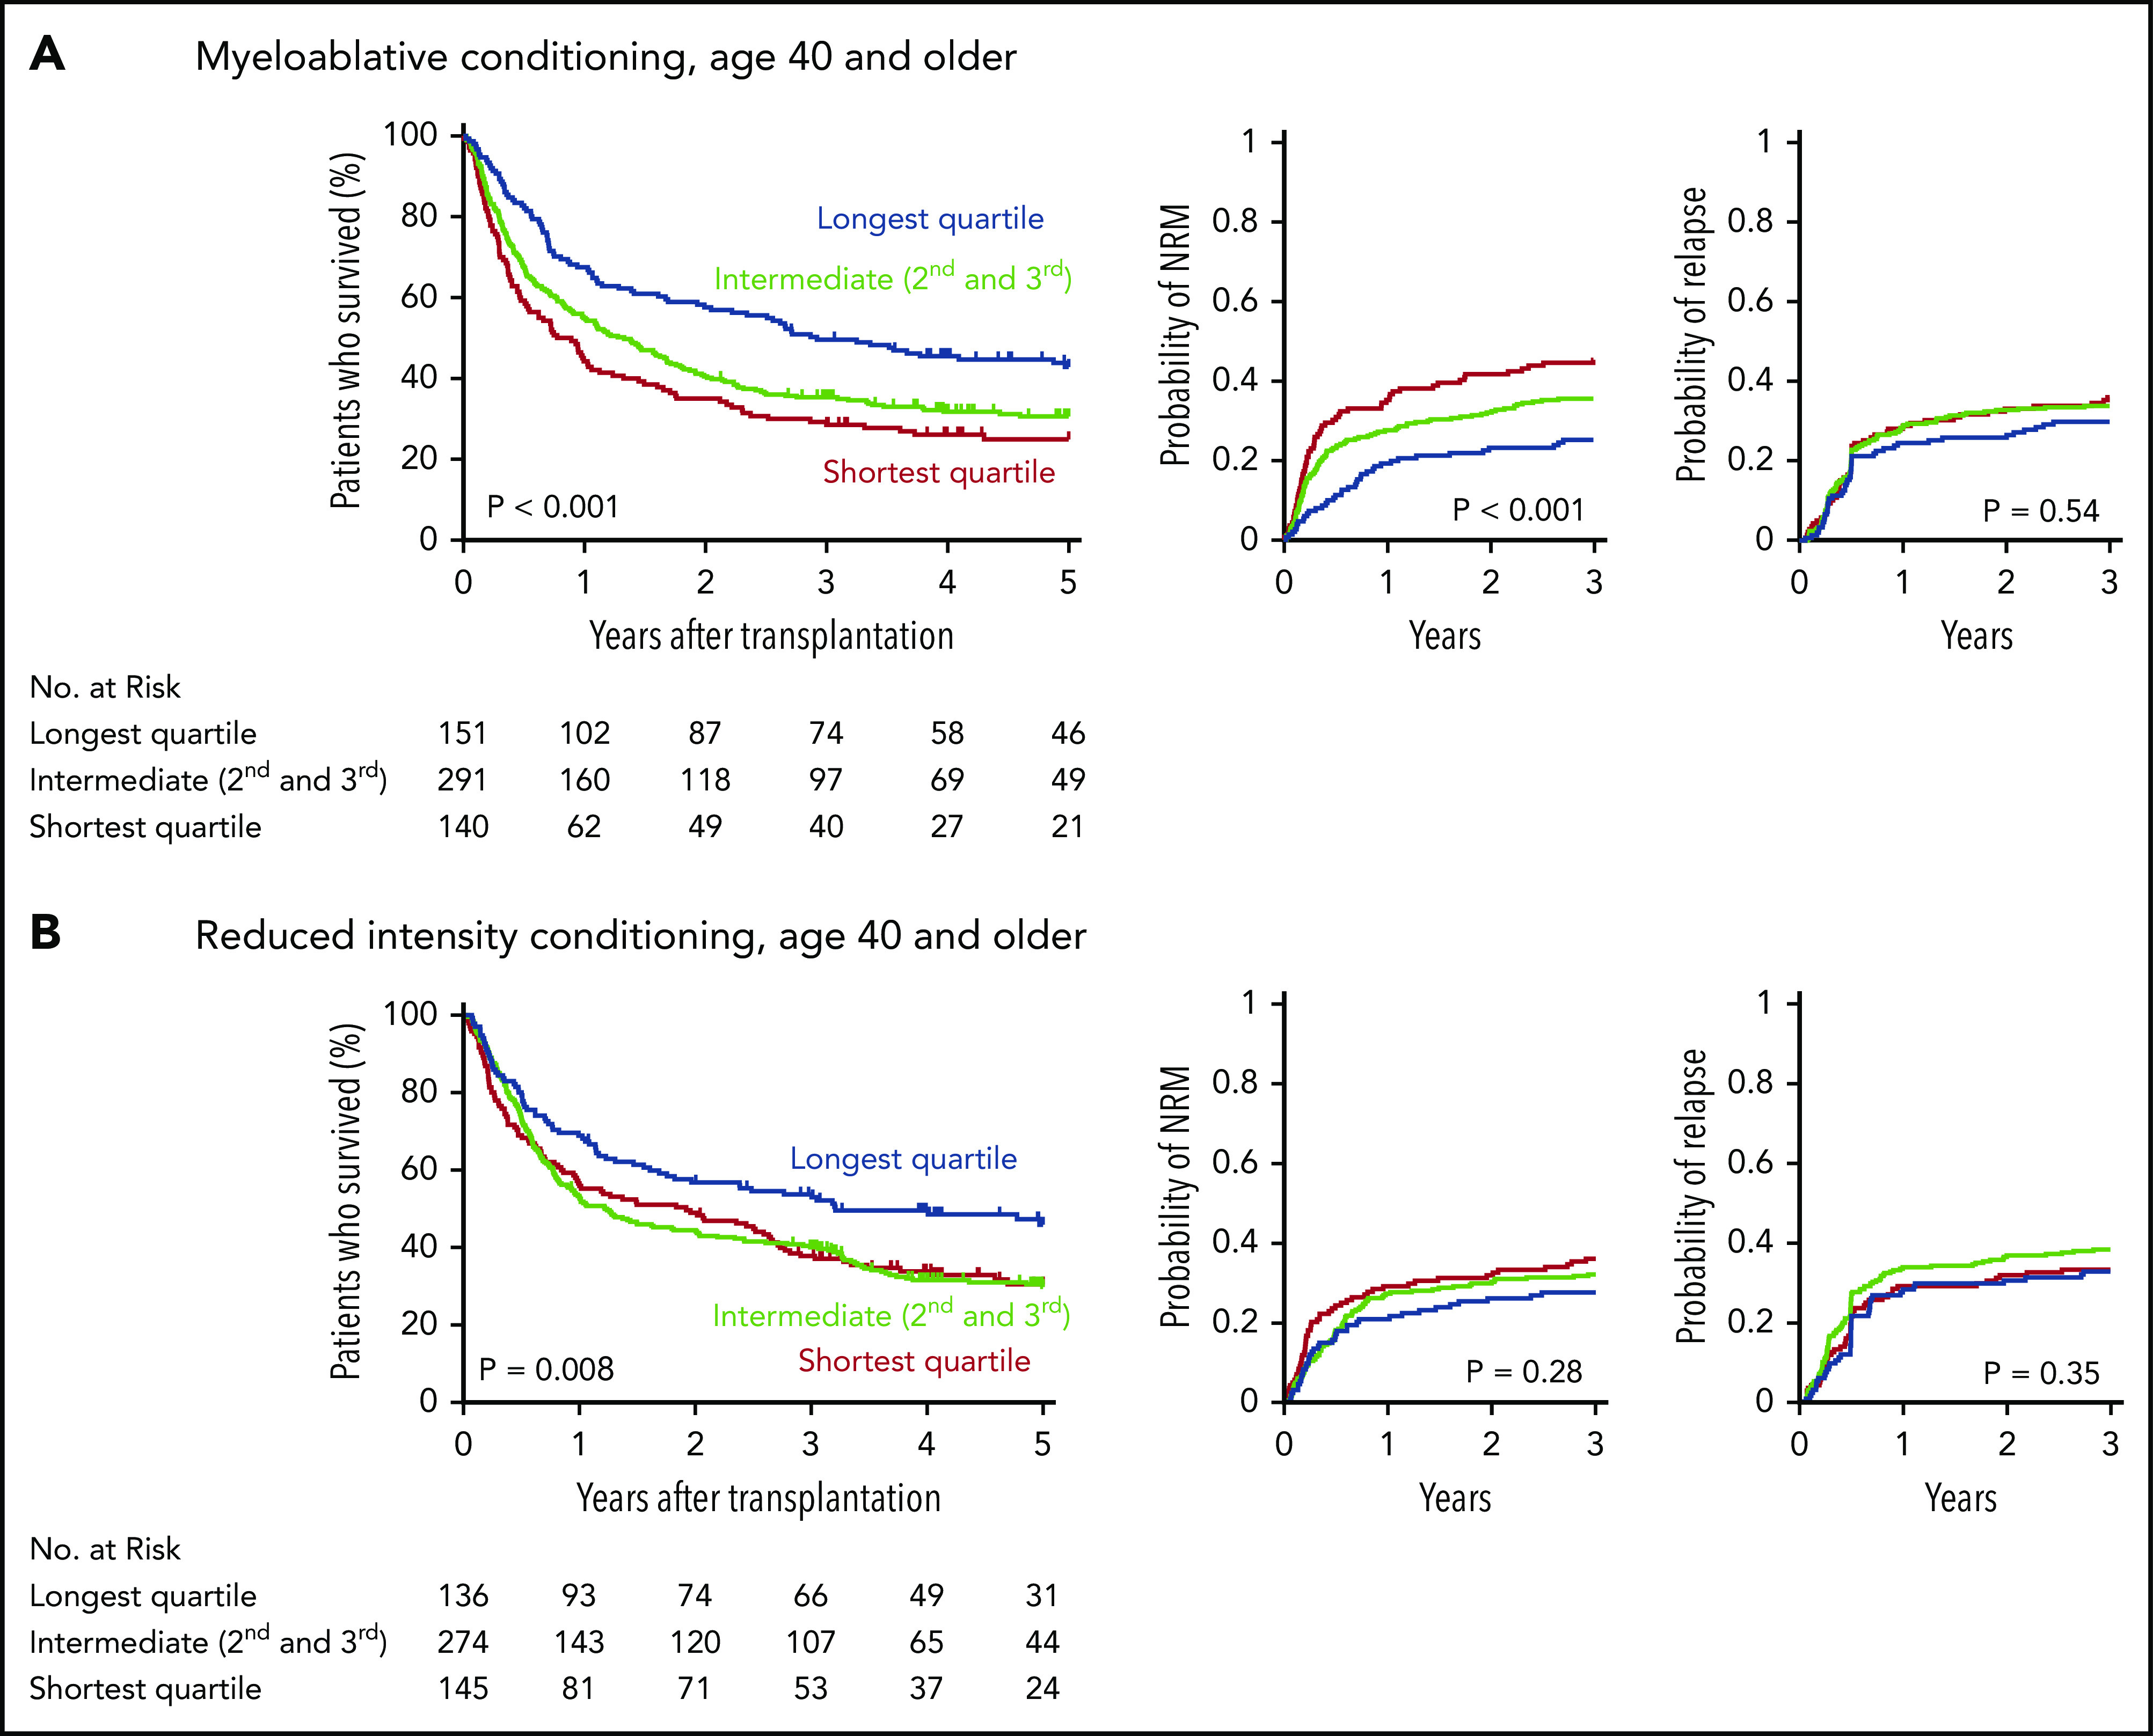
Figure 3.

Outcomes after transplantation by conditioning intensity. Shown are the Kaplan-Meier curves for overall survival and cumulative incidence curves for nonrelapse mortality and relapse based on telomere length group in patients who received myeloablative (A) or reduced-intensity (B) conditioning regimens. Telomere length groups are indicated by color: the shortest quartile (red), second and third quartiles (green), and the longest quartile (blue). Patient characteristics by telomere length quartiles in patients who received myeloablative and reduced-intensity conditioning, respectively, are shown in supplemental Tables 10 and 11.
