Figure 1.
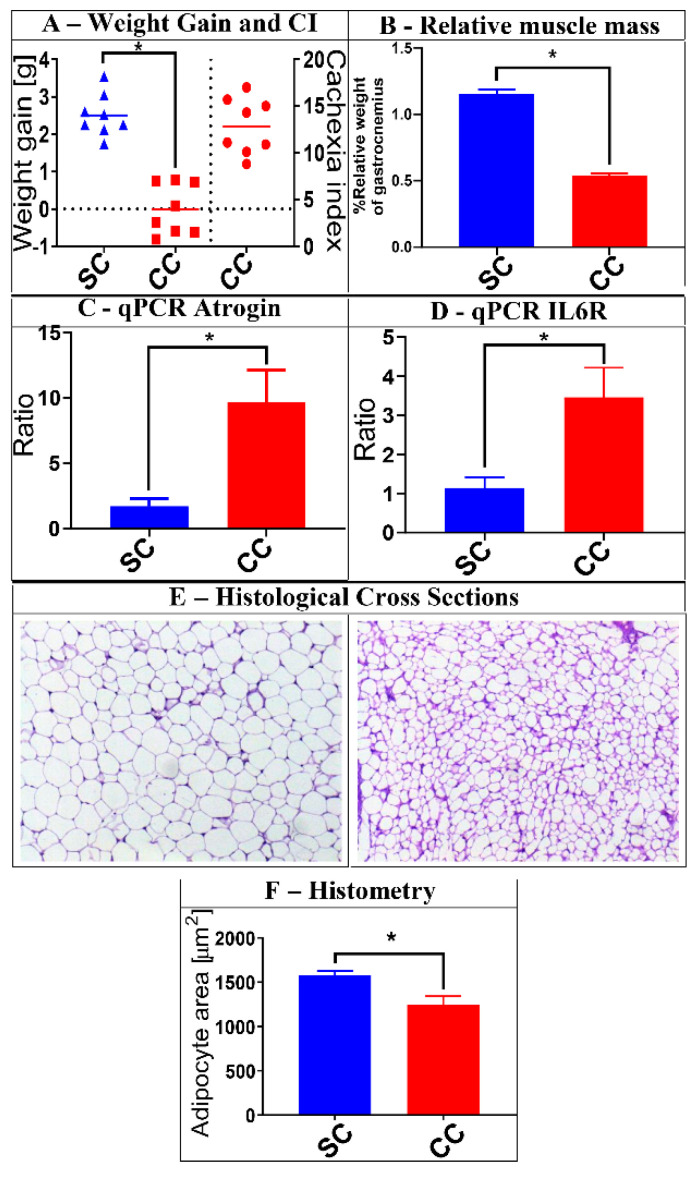
Characterization of cachexia in the animals selected for this study. A group of 16 animals was selected for the analyses described herein. Eight (8) of them received saline injection (SC group), while the other 8 were injected with Lewis lung carcinoma (LLC) cells (CC group). After 28 days, the animals were evaluated for a series of characteristics typically associated with cachexia. Panel (A) shows, on the left part of the graph, the average weight gain of the SC and CC animals 28 days after injection (tumor weight subtracted), as well as the Cachexia Indexes (CI) among CC animals (on the right part of the graph) (Weight gain: SC = 2.508 ± 0.1996; CC = −0.00625 ± 0.2391. Cachexia index: CC = 12.86 ± 1.06). Panel (B) shows the reduced relative mass of gastrocnemius muscle in CC animals, when compared to SC controls (SC = 1.151 ± 0.09864; CC = 0.5373 ± 0.04663). Panels (C,D) show that CC animals also display increased relative expression of muscular atrophy and inflammation markers (Atrogin and IL6R, respectively), as verified by qPCR (Atrogin: SC = 1.421 ± 0.3972; CC = 9.661 ± 2.471. IL6R: SC = 1.062 ± 0.1726; CC = 3.573 ± 0.707). Panel (E) shows examples of histological analyses made with epididymal adipose tissue obtained from SC (left) and CC (right) animals, demonstrating significant reduction in the average adipocyte area in CC animals. These reductions are confirmed by histometric evaluation of representative cross sections obtained from all animals within each group (Panel (F)) (Adipocyte area: SC = 1573 ± 45.83; CC = 1197 ± 77.71). Magnification of adipose tissue: 20×; * = p ≤ 0.05, after Mann–Whitney U test. Results for SC animals are shown in blue, while results for CC animals are shown in red. Plots represent mean and mean standard errors.

