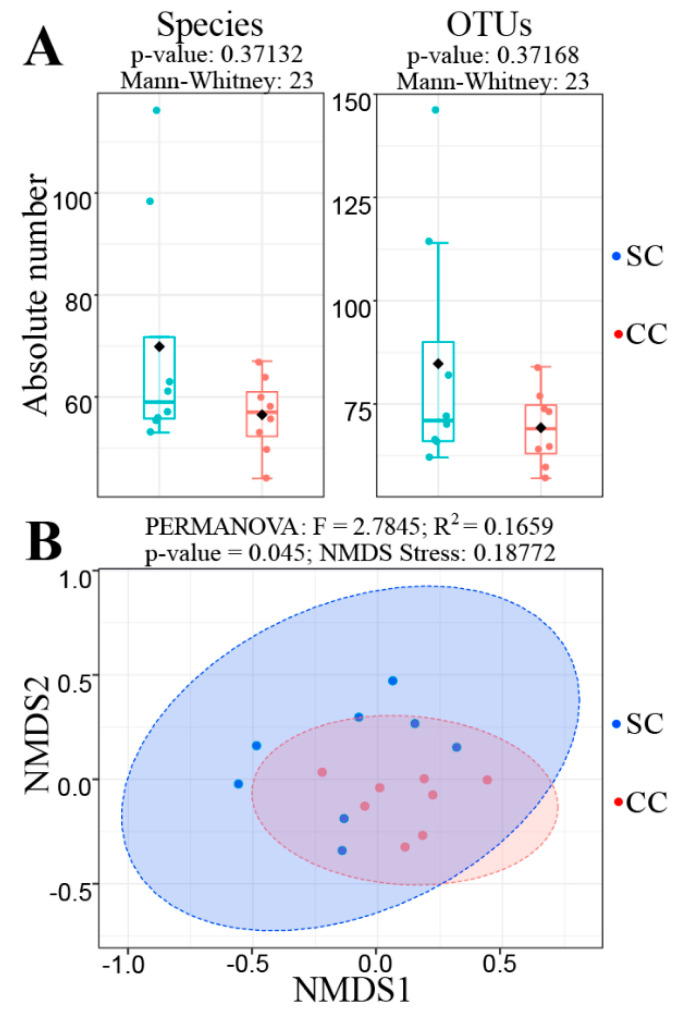
Figure 2.
Alpha and Beta diversity analyses comparing the mycobiota of SC and CC animals. Panel (A) shows the result of an alpha diversity analysis, displaying the absolute number of fungi obtained for the levels of species (left) and operational taxonomic units (OTU) (right), in both SC and CC animals. In both cases, it was not possible to verify significant changes in fungal alpha diversity between the two groups, since p-values obtained from such analyses, after a Mann–Whitney U test, were always above 0.05. Panel (B) shows the result of a Beta-diversity analysis to evaluate differences in composition between the fungal populations present in the stool samples from SC and CC animals. This analysis was performed with the aid of a non-metric multidimensional scaling (NMDS) algorithm (based on the Bray–Curtis index), using the same OTU Table described above. The NMDS analysis shows that differences in mycobiota composition allow statistically significant discrimination between the SC and CC groups (at p = 0.045, as verified by PERMANOVA), although the two main components of the NMDS analysis do not allow us to visualize such distinction. Animals from the SC group are shown in blue, while animals from the CC group are shown in red.

