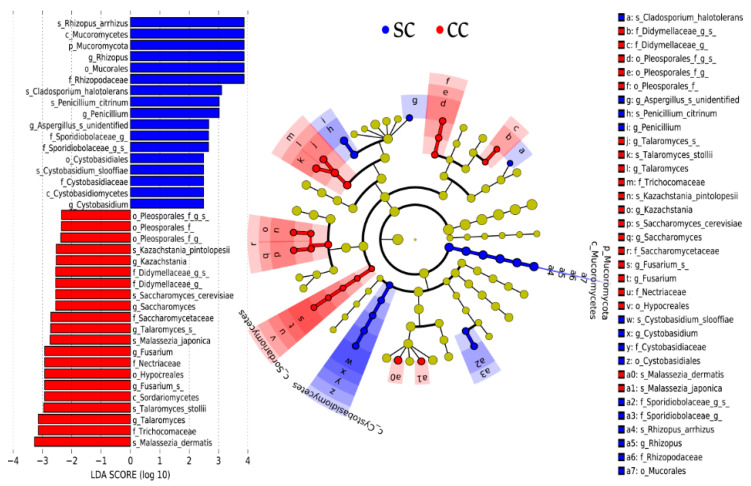
Figure 4.
Identification of the main fungal taxa differentially represented in stool samples from SC and CC animals. The Core 70 OTU Table (see Methods) was subjected to a linear discriminant analysis effect size (LEfSe) analysis to identify differentially represented taxa between CC and SC animals. Taxa preferentially present in CC animals displayed Linear Discriminant Analysis (LDA) Scores ≤2, while taxa preferentially present in SC animals displayed LDA Scores ≥2. All taxa identified in this analysis display statistical significance at p ≤ 0.05, which was used as a threshold in the LEfSe analysis. All differentially represented taxa (at different taxonomic levels) are shown in the left panel of the figure and their distribution in a phylogenetic dendrogram is shown at the center panel. The concentric circles of the dendrogram show the taxonomic hierarchy, from phylum (innermost circle) to species (outermost circle) and the different microorganisms distributed in each node can be identified with the aid of the legend shown on the right panel. Microorganisms overrepresented in stool samples from SC animals are shown in blue, while microorganisms overrepresented in stool samples from CC animals are shown in red.

