Figure 2.
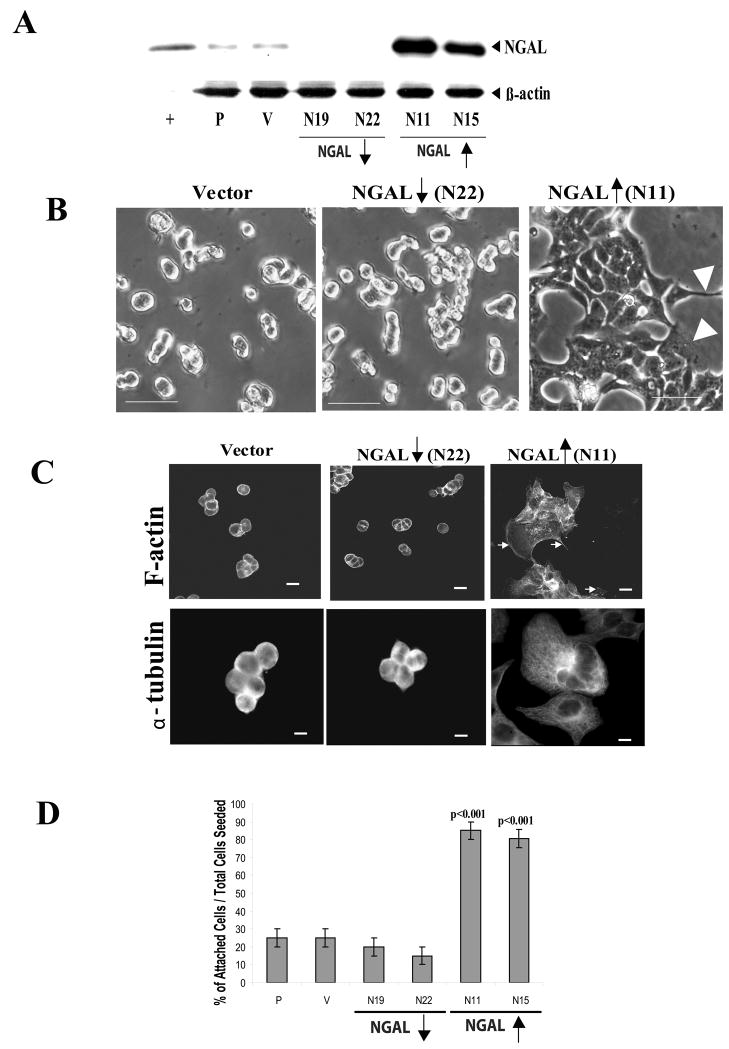
NGAL-overexpression altered cytoskeletal organization and increased cell-matrix adhesion in the KM12C colon carcinoma cells. A: Analysis of NGAL expression by immunoblotting in parental (P), empty vector-transfected control (V), and NGAL stable clones transfected with NGAL/pDsRed-N2 containing anti-sense sequence (N19 and N22) and NGAL/pcDNA3.1(+) containing sense sequence (N11 and N15), respectively. A purchased NGAL/MMP9 protein was used as a positive control (+). β-actin levels were also monitored to normalize for protein loading. The empty vector-transfected control cells show a level of NGAL expression similar to that of the parental cells. However, compared with the parental and vector-transfected control cells, the N19 and N22 clones show decreased expression in NGAL (downward arrow), whereas the N11 and N15 clones show over-expression of NGAL (upward arrow). B: Phase contrast images of collagen IV adherent vector-transfected, NGAL-underexpressing (downward arrow, N22), and NGAL-overexpressing (upward arrow, N11) cells after 24 hr incubation. The images were taken with a ZEISS HAL 100 microscope at a magnification of 200x. Scale bar, 50 μm. The vector-transfected cells are tightly compact, with several cell layers in the center, whereas the NGAL-underexpressing cells are smaller in size and show a more aggregated cellular growth pattern compared with the vector transfectants. In contrast, the NGAL-overexpressing cells have more angular and flat morphology with increased spreading of peripheral cells and cellular cytoplasmic projections compared with the vector transfectants (arrowheads, right panel). In addition, the cells are larger in size compared with the vector control cells. C: Morphologic analysis of the cytoskeletal organization of collagen IV-adherent NGAL-transfected cells. The cells were incubated for 24 hr and then fixed and stained with phalloidin-TR for F-actin and anti-α-tubulin antibody for tubulin, respectively. The F-actin structure of the cells was analyzed with confocal microscopy. The vector-transfectants have a cortical F-actin staining pattern, in which F-actin is concentrated at the cell-cell junctions and at the edges of the cells in contact with the substratum (upper left panel). The NGAL-underexpressing cells show a similar F-actin staining pattern as the vector transfectant, except the cells are smaller (center panel). In contrast, the NGAL-overexpressing cells are larger and F-actin is located diffusely within the cells and at the edges of the cytoplasmic projections (upper right panel, arrows). The microtubule structure of the cells was analyzed by phase contrast microscopy. A weak microtubule structure is evident in the vector-transfected and NGAL-underexpressing cells (lower left and center panels). In contrast, as is the case for F-actin staining, the NGAL-overexpressing cells are larger and exhibit prominent microtubules extending from the cell centers to the edges. The gray images are shown, and the scale bar is 50 μm.
D: Quantitation data from the cell-attachment assay. The cell-attachment assay was carried out as described in the “Experimental Procedures” and the bar graph shows the percentage of attached cells among the total cells seeded, with the brackets representing the standard deviation of triplicate samples. One representative graph from two independent experiments is shown. A significant increase in adhesion is evident for the NGAL-overexpressing clones (N11and N15: p<0.001).

