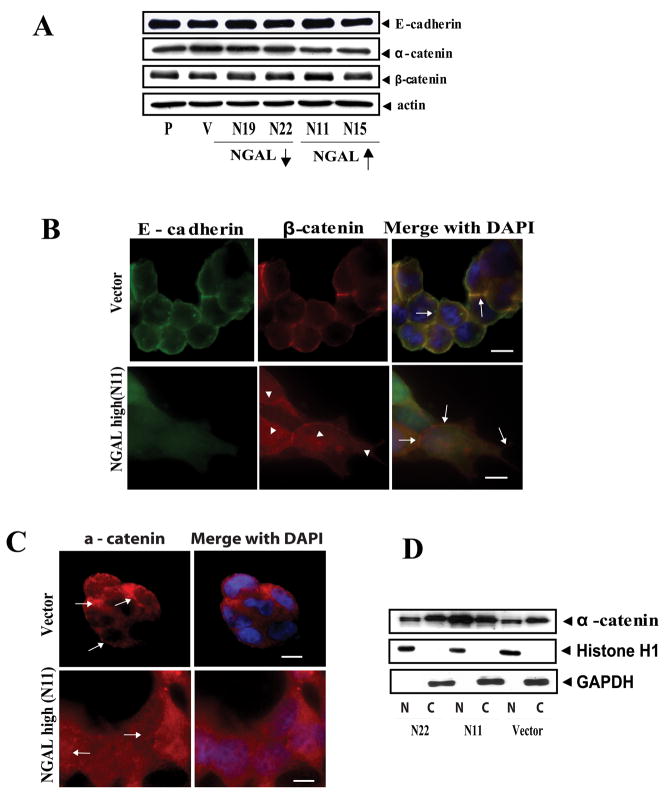
Figure 4.
NGAL overexpression altered E-cadherin cellular localization in KM12C colon carcinoma cells. A: Western blot analysis of E-cadherin, α-catenin, and β-catenin protein levels in collagen IV-adherent cells. Whole cell lysate extracted from parental, empty vector-transfected control, and NGAL-transfected cells were subjected to Western blot analysis. P: parental; V: empty vector-transfected control cells; N19 and N22: NGAL-underexpressing cells (downward arrow); N11 and N15: NGAL-overexpressing cells (upward arrow). For the proteins tested, no significant differences are evident among the different cell lines. The blot was re-probed with β-actin to normalize for protein loading. B: Morphologic analysis of cellular localization of endogenous E-cadherin and β-catenin in the collagen IV-adherent vector-transfected and NGAL-overexpressing cells (N11). Endogenous E-cadherin and β-catenin were visualized by immunofluorescence staining using anti-E-cadherin-FITC and anti-β-catenin TRITC antibodies. In the vector control cells, E-cadherin and β-catenin are concentrated and co-localized at the cell-cell junctions (shown in yellow color, upper panel, arrows). However, the NGAL-overexpressing cells are more extended, and E-cadherin mainly assumes a diffuse pattern and is dissociated from β-catenin at the cell-cell junctions (lower panel, arrows). β-catenin staining shows partial diffuse staining in the cytoplasm and partial staining in cell-cell borders (lower panel, arrowheads). The images were taken with a ZEISS HBO 100 phase contrast microscope at a magnification of 630x. Cell nuclei were counterstained with DAPI. Scale bar is 50 μm. C: Localization of endogenous α-catenin in the collagen IV-adherent vector-transfected and NGAL-overexpressing cells (N11). The endogenous α-catenin was visualized by double fluorescence staining. In the vector-transfected cells, the α-catenin concentrates at cell-cell junctions (upper panel), but a diffuse and nuclear localization pattern is seen in the NGAL-overexpressing cells (lower panel). Cell nuclei were counterstained with DAPI. Scale bar is 50 μm. D: Western blot analysis of α-catenin protein level using cytoplasmic (C) and nuclear (N) protein fractionations extracted from the vector-transfected cells (V) and the NGAL-overexpressing (N11) and –underexpressing cells (N22), respectively. The blot was re-probed with Histone H1 and GAPDH to control for the quality of the fractionations and protein loading.

