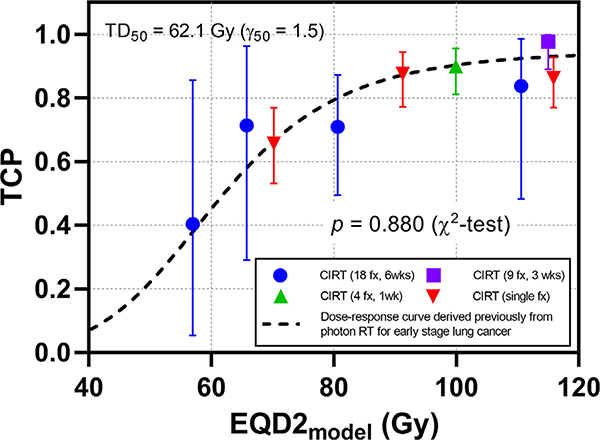
Fig. 2.
All CIRT cohorts with best-fit parameter values (α = 1.12 Gy−1, α/β = 23.9 Gy, OERI = 1.08 and OERH = 1.01), overlaid with the previously derived photon 2 Gy/weekday dose–response curve (TD50 = 62.1 Gy and γ50 = 1.5, dashed curve). The resulting χ2 test p-value was 0.880, indicating a good fit.

