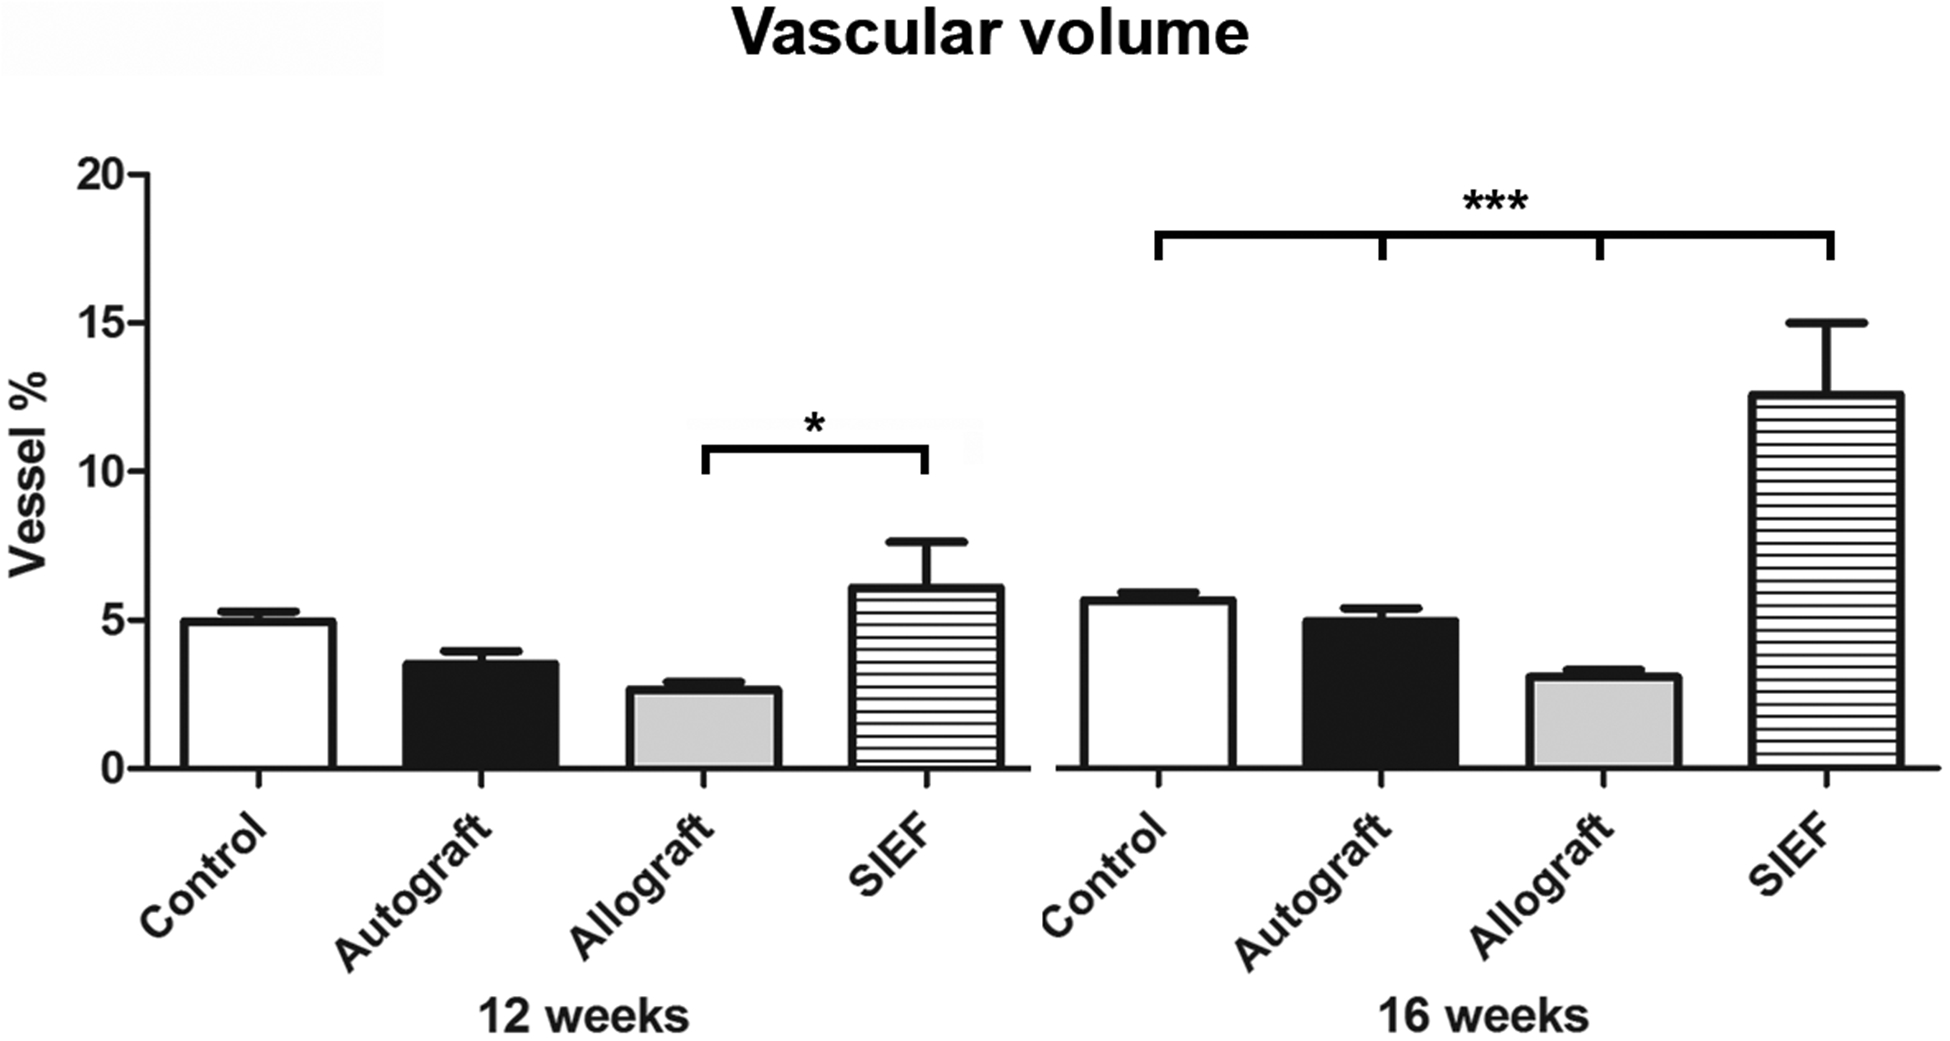
Figure 4. Vascular volume of nerve groups at 12- and 16 weeks using micro CT.

Results of control, autograft, allograft and allograft wrapped in a pedicled superficial inferior epigastric fascial (SIEF) flap were expressed as a percentage (vessel %) of the total nerve area and were given as the mean ± SEM. *Indicates significance at P<0.05, *** P<0.0001.
SEM = Standard error of the mean
