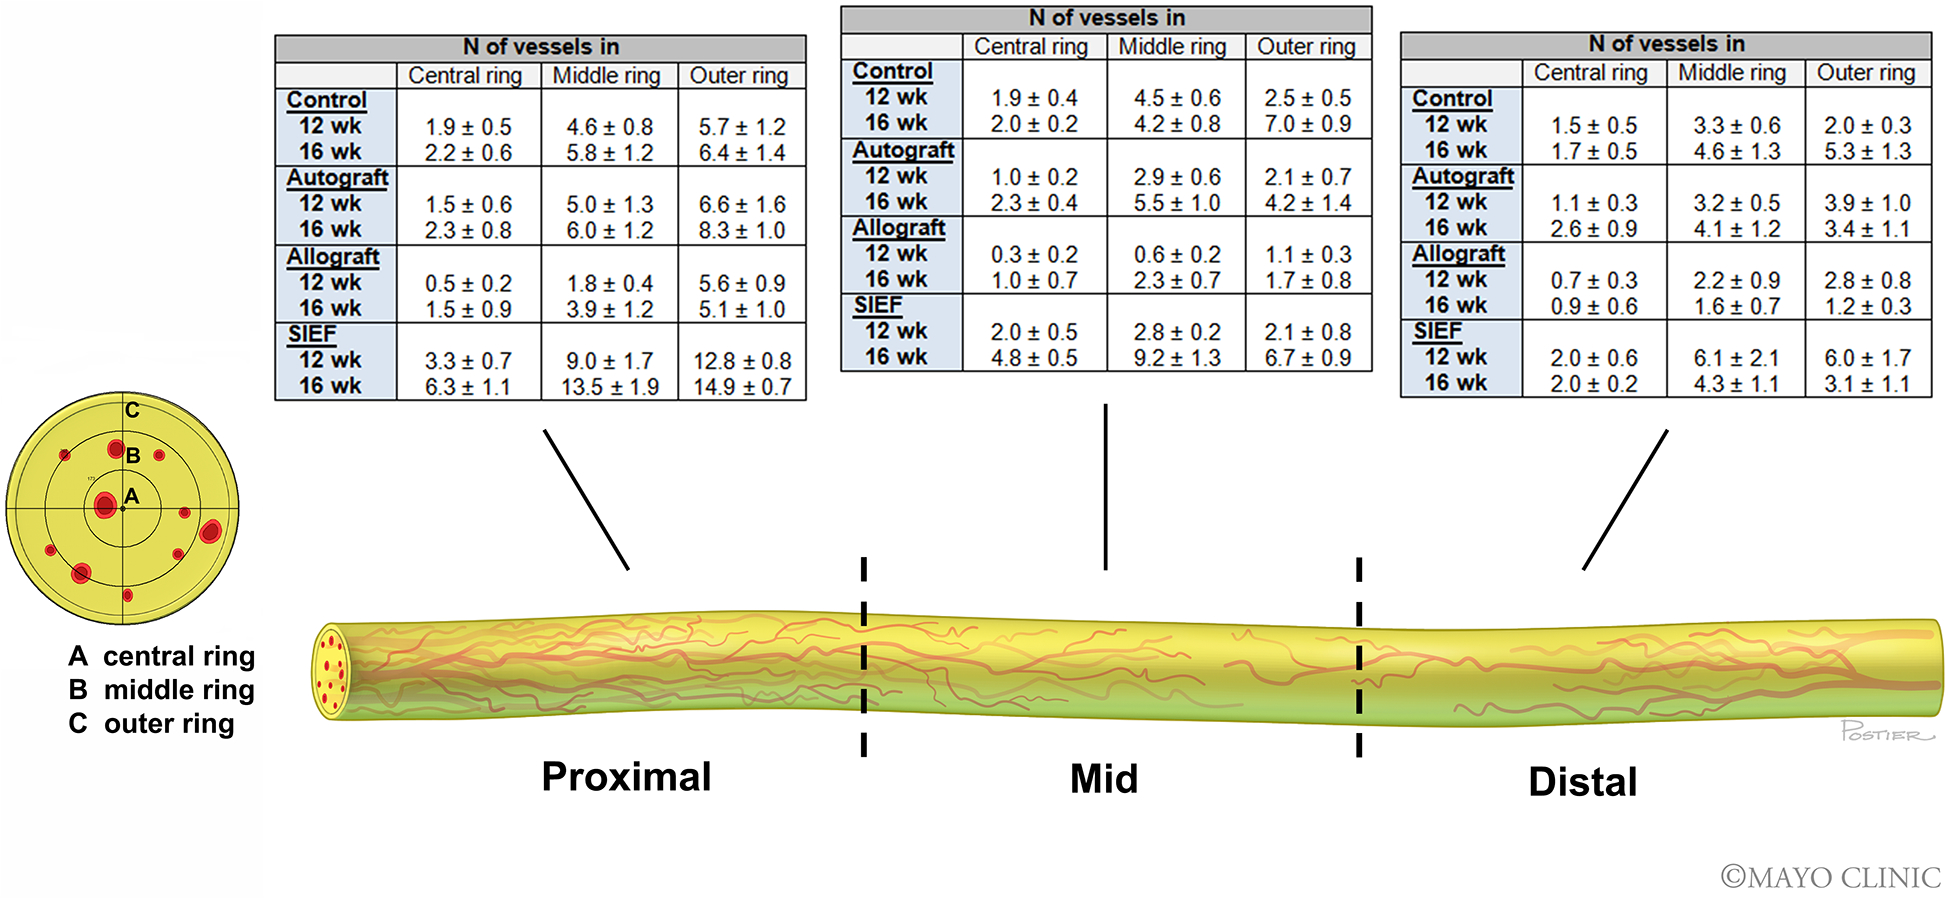
Figure 6. Nerve vascularization patterns of nerve groups at 12- and 16 weeks.

Micro CT cross-sectional images throughout the length of the nerve grafts were obtained. The length of the nerve was divided into three sections: (I) proximal, (II) mid and (III) distal. The cross-sectional images were divided into three rings: (A) central ring, (B) middle ring, (C) outer ring to count the number of vessels. Nerve tissue was depicted in yellow and the vessels were depicted in red. Tables describe the number of vessels in each of the rings per nerve section (proximal, mid and distal) for control, autograft, allograft and allograft wrapped in a superficial inferior epigastric artery fascia (SIEF) flap. The first row denotes the number of vessels (mean ± SEM) at 12 weeks and the second row at 16 weeks.
SEM = Standard error of the mean
