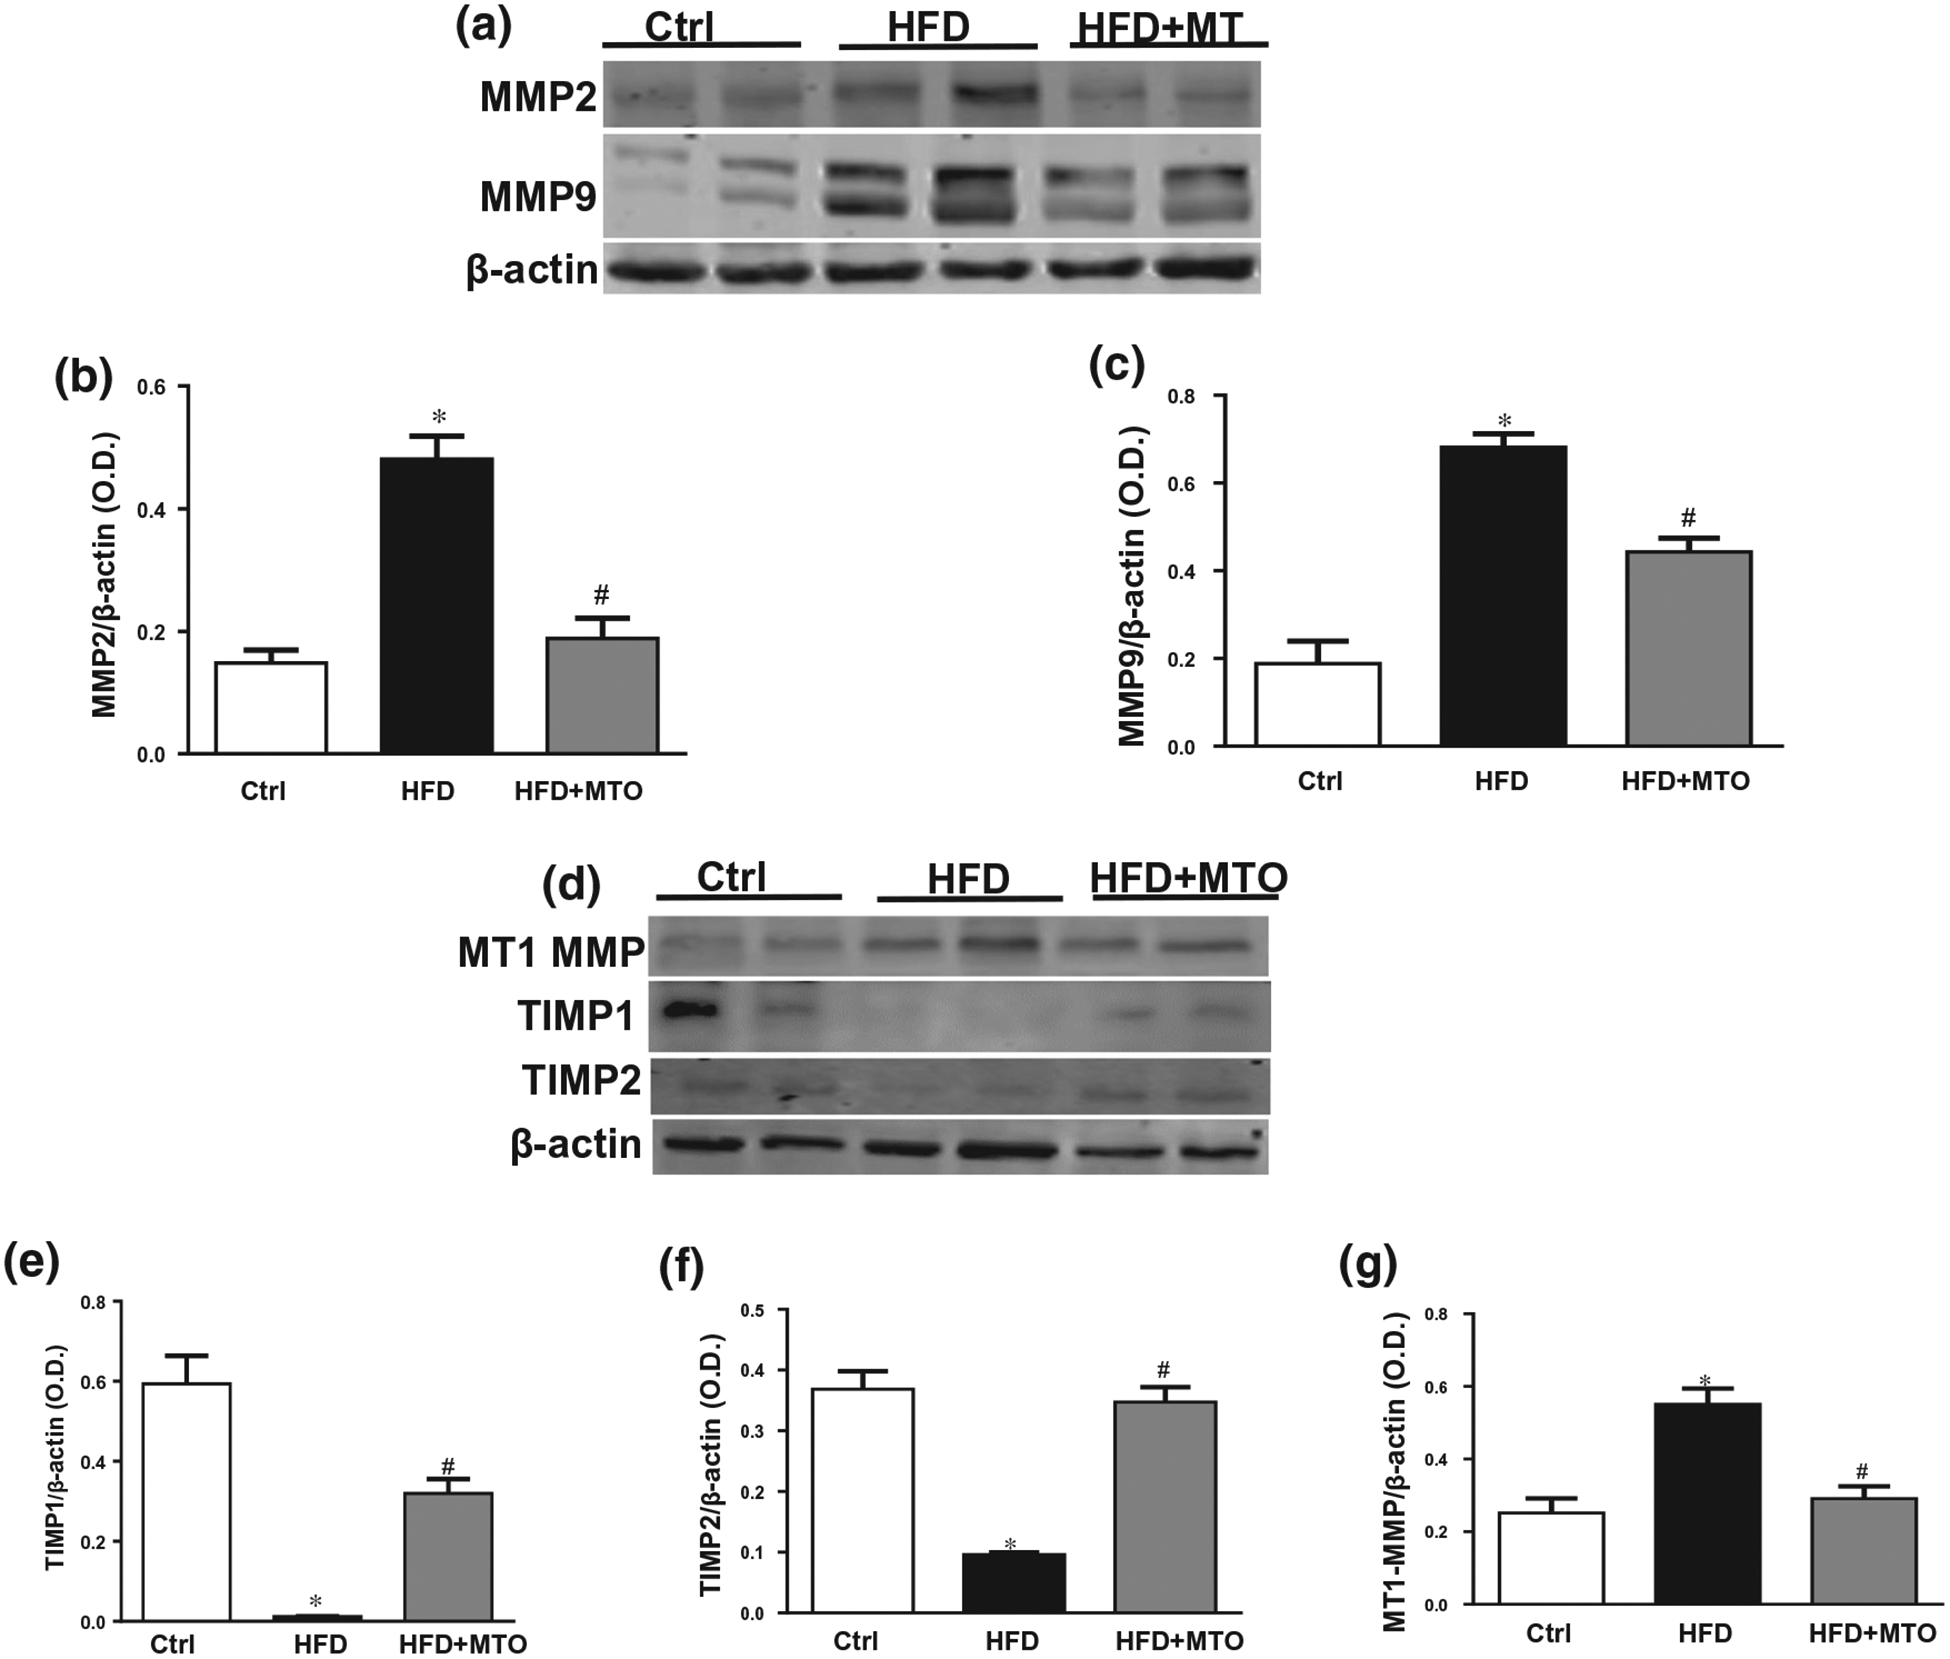
FIGURE 3.

Hepatic levels of matrix metalloproteinase (MMP) 2, MMP9, membrane type 1-MMP, tissue inhibitor of MMP (TIMP)1 and TIMP2 normalized to β-actin. (a) Representative Western blots, (b) Hepatic levels of MMP2, (c) Hepatic levels of MMP9, (d) Representative Western blots, (e) Hepatic levels of MT1-MMP, (f) Hepatic levels of TIMP1, (g) Hepatic levels of TIMP2. *p < .05 as compared to the control (Ctrl) #p < .05 as compared to HFD. n = 6/group
